Fig. 11.
Download original image
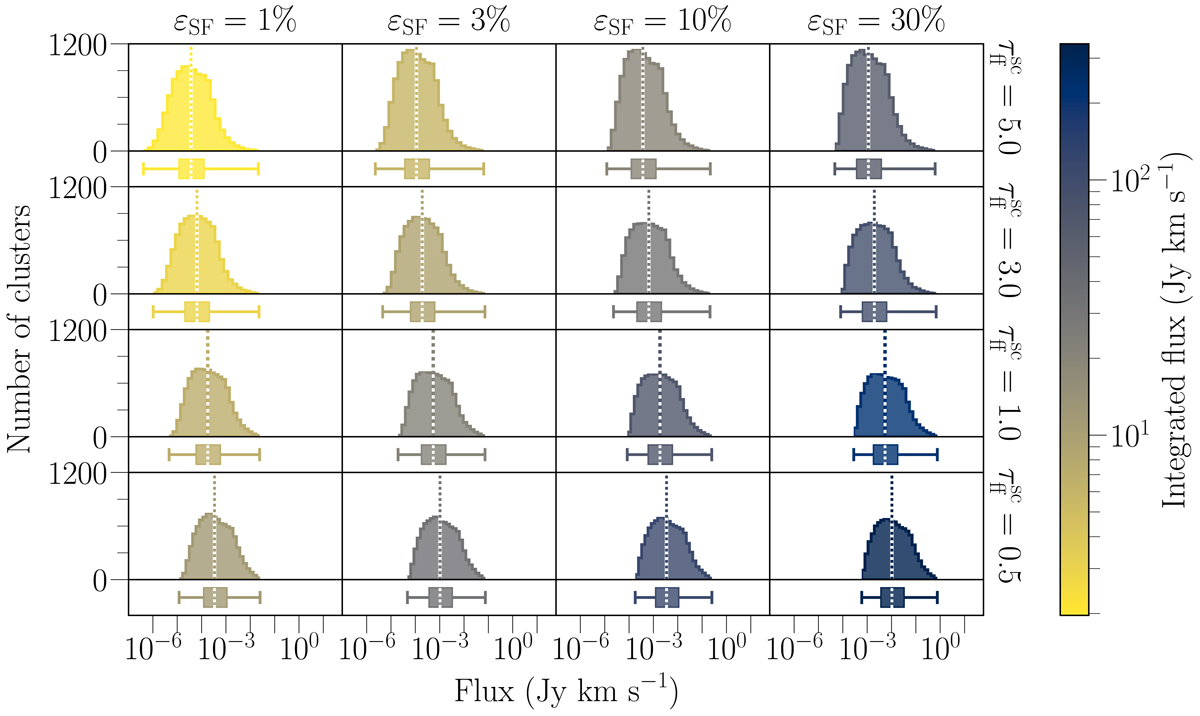
Distributions of cluster emission derived for simulations with varying free-fall time scaling factor ![]() and star formation efficiency εSF. The vertical dashed lines correspond to the median flux of each distribution and a measure of central tendency in form of IQR is presented in the bottom box plots with whiskers spreading from the beginning (0%) to the end (100%) of each distribution. These are the mean distributions from a series of ten simulations for each varying pair of
and star formation efficiency εSF. The vertical dashed lines correspond to the median flux of each distribution and a measure of central tendency in form of IQR is presented in the bottom box plots with whiskers spreading from the beginning (0%) to the end (100%) of each distribution. These are the mean distributions from a series of ten simulations for each varying pair of ![]() and εSF. The y- and x-axes have the same ranges for all rows and columns. The color-coding is based on the integrated fluxes of each distribution. The exact values of these fluxes are available in Fig. A.1.
and εSF. The y- and x-axes have the same ranges for all rows and columns. The color-coding is based on the integrated fluxes of each distribution. The exact values of these fluxes are available in Fig. A.1.
Current usage metrics show cumulative count of Article Views (full-text article views including HTML views, PDF and ePub downloads, according to the available data) and Abstracts Views on Vision4Press platform.
Data correspond to usage on the plateform after 2015. The current usage metrics is available 48-96 hours after online publication and is updated daily on week days.
Initial download of the metrics may take a while.