Fig. 1.
Download original image
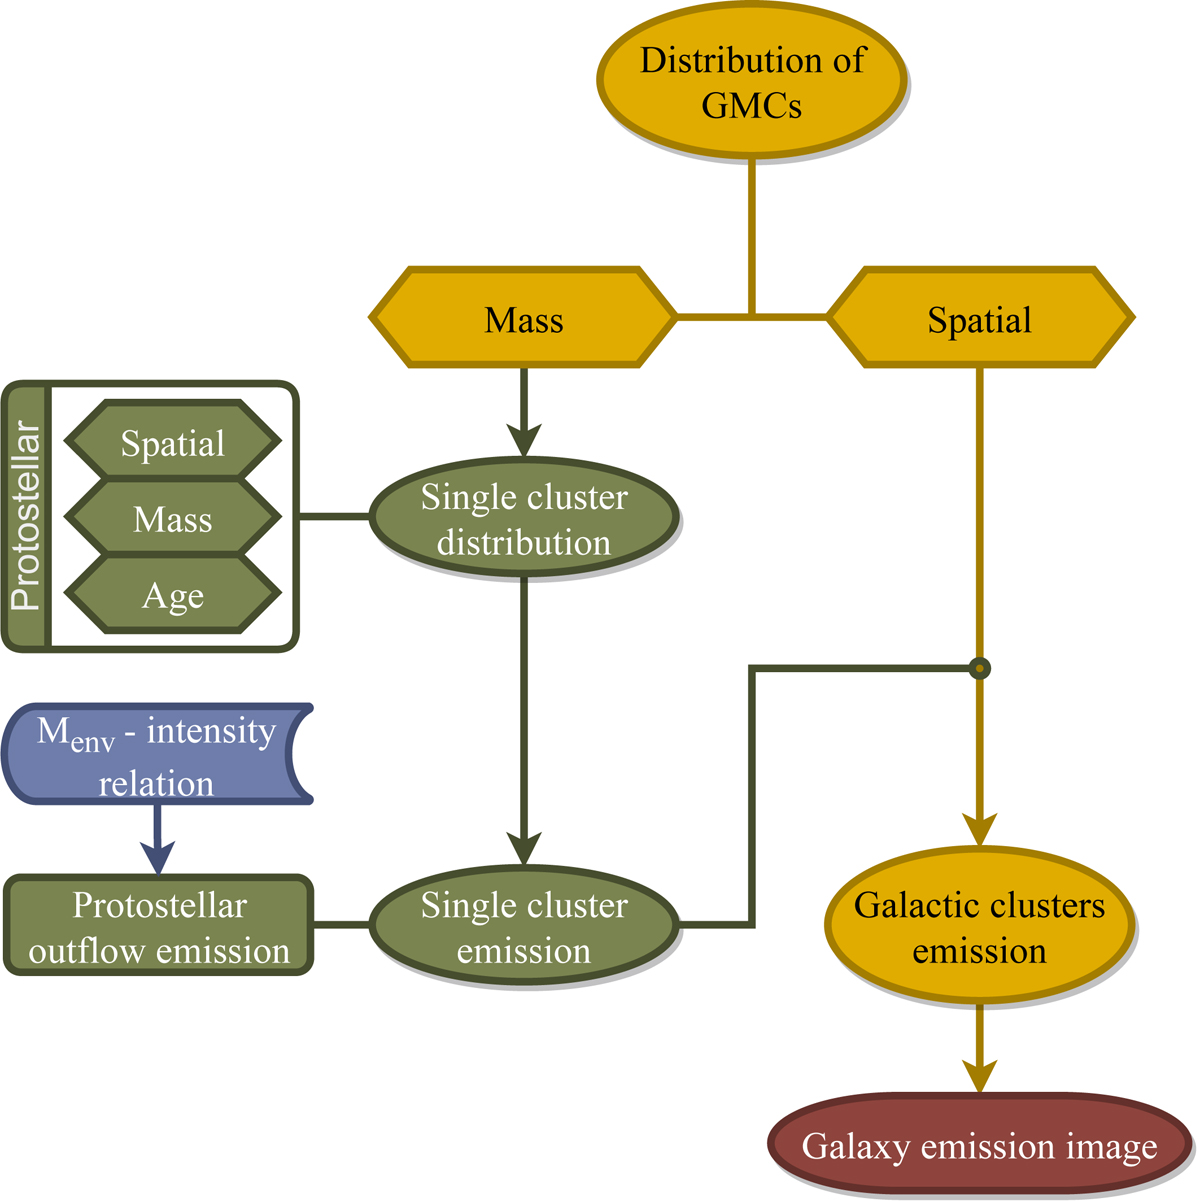
Schematic flowchart of the galaxy-in-a-box model. The computation starts with generating the spatial (Sect. 2.2.1) and mass (Sect. 2.2.2) distributions of GMCs in the simulated galaxy. The GMC mass distribution serves as the input to the module generating the protostellar spatial, mass, and age distributions within individual star-forming clusters. Here, each randomly chosen GMC mass is an initial mass of the cluster. Having calculated these distributions, the model uses them to assign molecular outflow emission to each protostar within the cluster, based on the envelope mass–outflow intensity relation calculated using the Water Emission Database (Sect. 2.3). After repeating these calculations for all GMCs, the emission and mass of star-forming clusters are returned to the galaxy-in-a-box model. Subsequently, the model merges the spatial distribution of the initial GMCs with water emission emerging from the corresponding star-forming clusters. Once the model returns the expected emission from the galaxy, this raw galactic emission grid is convolved with a Gaussian beam, producing the integrated intensity image of the galaxy. In this flowchart yellow corresponds to the galactic part of the model (Sect. 2.2), green to the cluster model (Sect. 2.1), red to the last stage of the model, and blue to the external data input.
Current usage metrics show cumulative count of Article Views (full-text article views including HTML views, PDF and ePub downloads, according to the available data) and Abstracts Views on Vision4Press platform.
Data correspond to usage on the plateform after 2015. The current usage metrics is available 48-96 hours after online publication and is updated daily on week days.
Initial download of the metrics may take a while.