Open Access
Fig. 3
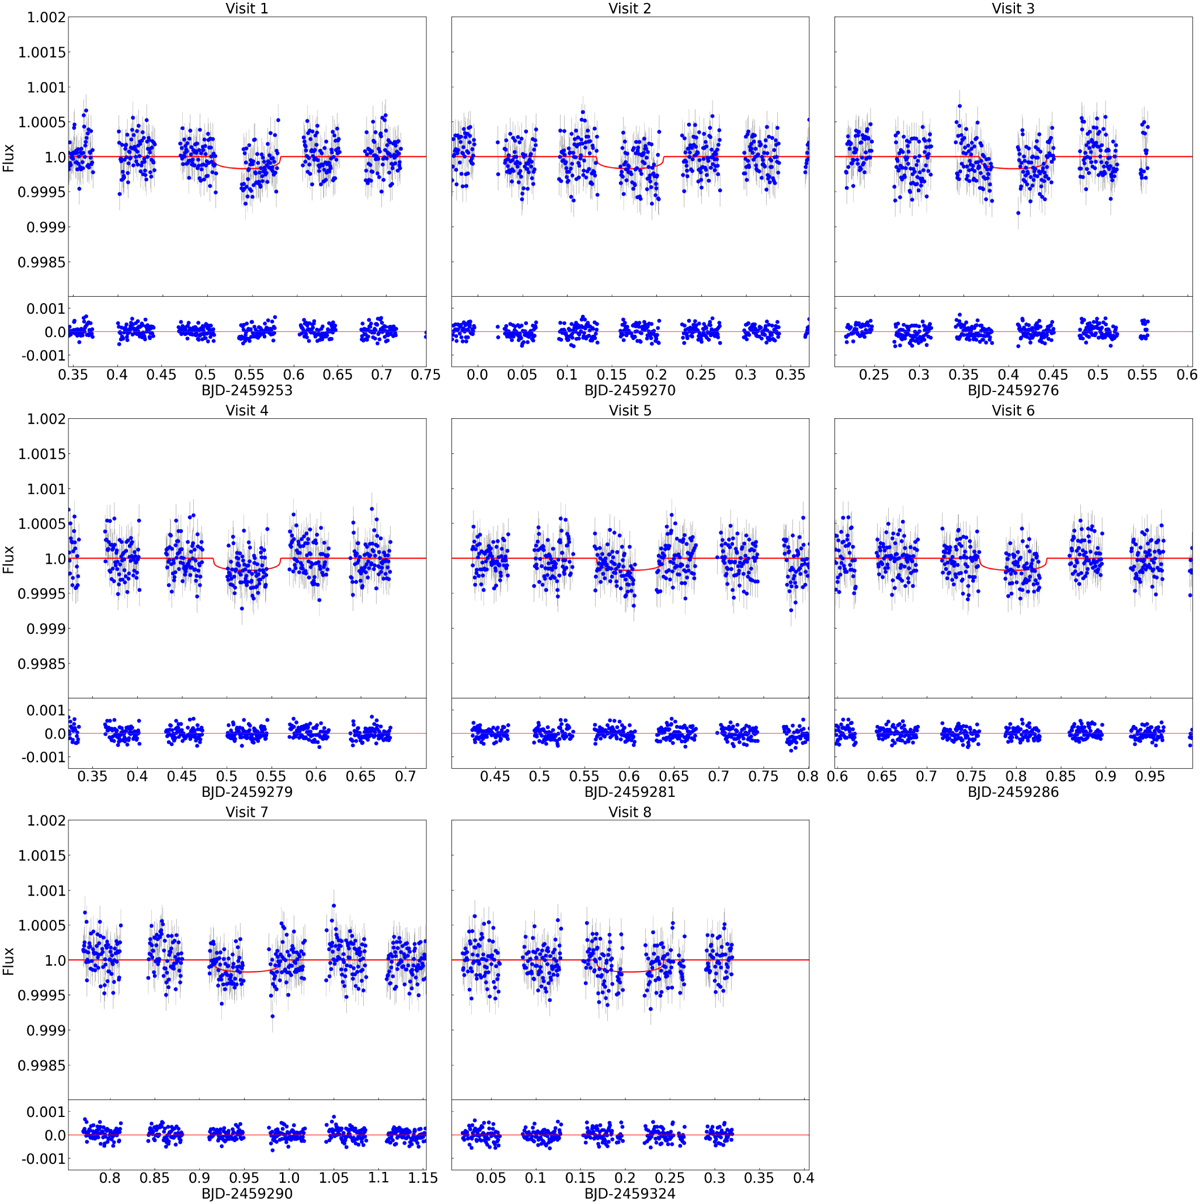
Download original image
The eight detrended CHEOPS light curves of planet b. In each plot, the upper panels show the detrended flux (blue circles) with the best-fitting transit model (red line). The lower panels display the residuals, with the zero-level marked as a red line.
Current usage metrics show cumulative count of Article Views (full-text article views including HTML views, PDF and ePub downloads, according to the available data) and Abstracts Views on Vision4Press platform.
Data correspond to usage on the plateform after 2015. The current usage metrics is available 48-96 hours after online publication and is updated daily on week days.
Initial download of the metrics may take a while.