Fig. 2
Download original image
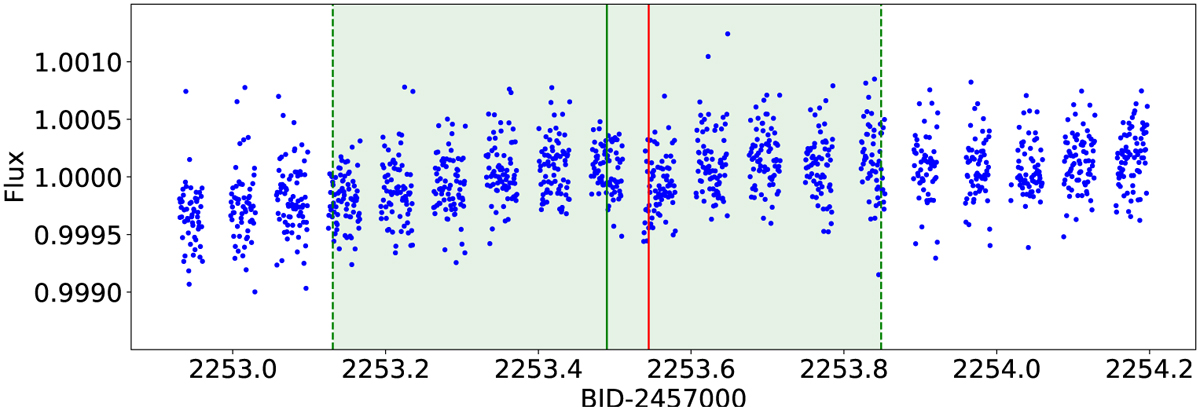
Raw data points of the first CHEOPS visit (blue circles). The transit of the 1.04 d planet is visible at the centre of the visit. The mid-transit time, as predicted by the TESS ephemeris, is highlighted with a vertical green line, while the area coloured in light green is the corresponding 3 σ interval of confidence. The mid-transit time predicted with the ephemeris in the third column of Table 5 is marked with a vertical red line. The time difference between the red and the green lines is ~1 h.
Current usage metrics show cumulative count of Article Views (full-text article views including HTML views, PDF and ePub downloads, according to the available data) and Abstracts Views on Vision4Press platform.
Data correspond to usage on the plateform after 2015. The current usage metrics is available 48-96 hours after online publication and is updated daily on week days.
Initial download of the metrics may take a while.