Fig. 11
Download original image
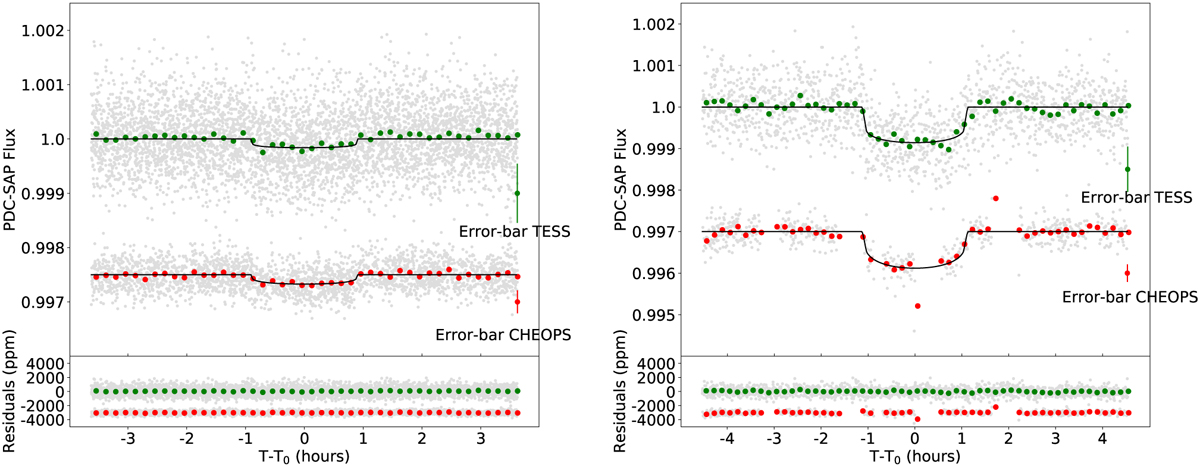
Phase-folded light curve of planets HD 93963 Ab (left panel), and c (right panel). Upper panels: photometric measurements are shown with light grey circles, along with the 10-minute binned data (green circles for TESS, and red for CHEOPS), and the best-fitting transit model (solid black line). On the right-hand side of the plot, we also show the size of TESS and CHEOPS error-bars, respectively in green and red. Lower panels: residuals, colour-coded as above.
Current usage metrics show cumulative count of Article Views (full-text article views including HTML views, PDF and ePub downloads, according to the available data) and Abstracts Views on Vision4Press platform.
Data correspond to usage on the plateform after 2015. The current usage metrics is available 48-96 hours after online publication and is updated daily on week days.
Initial download of the metrics may take a while.