Fig. 1
Download original image
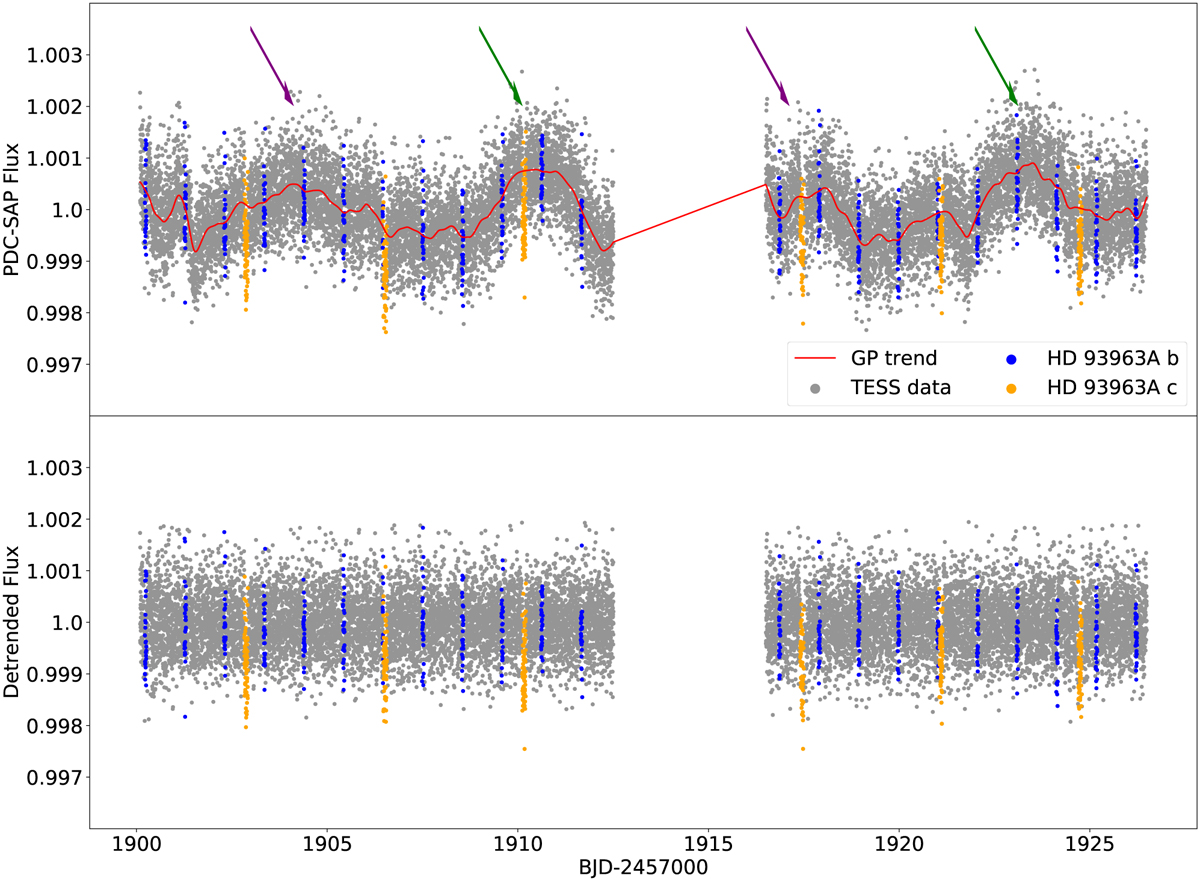
TESS light curve of HD 93963 A. In-transit data points of the 3.65 d and the 1.04 d candidate are marked in yellow and blue, respectively. Upper panel: PDC-SAP flux (grey) and detrending model (red), as obtained with citlalicue (Sect. 2.2). The arrows point to the repeated maxima we identified in the light curve: the purple arrows points to the maximum at ~1905 (BJD-2457000) and at its repetition at ~1918 (BJD-2457000). The green arrows point to the second maxima, that appears at ~1911 (BJD-2457000) and at ~1924 (BJD-2457000). Lower panel: detrended flux.
Current usage metrics show cumulative count of Article Views (full-text article views including HTML views, PDF and ePub downloads, according to the available data) and Abstracts Views on Vision4Press platform.
Data correspond to usage on the plateform after 2015. The current usage metrics is available 48-96 hours after online publication and is updated daily on week days.
Initial download of the metrics may take a while.