Fig. 9.
Download original image
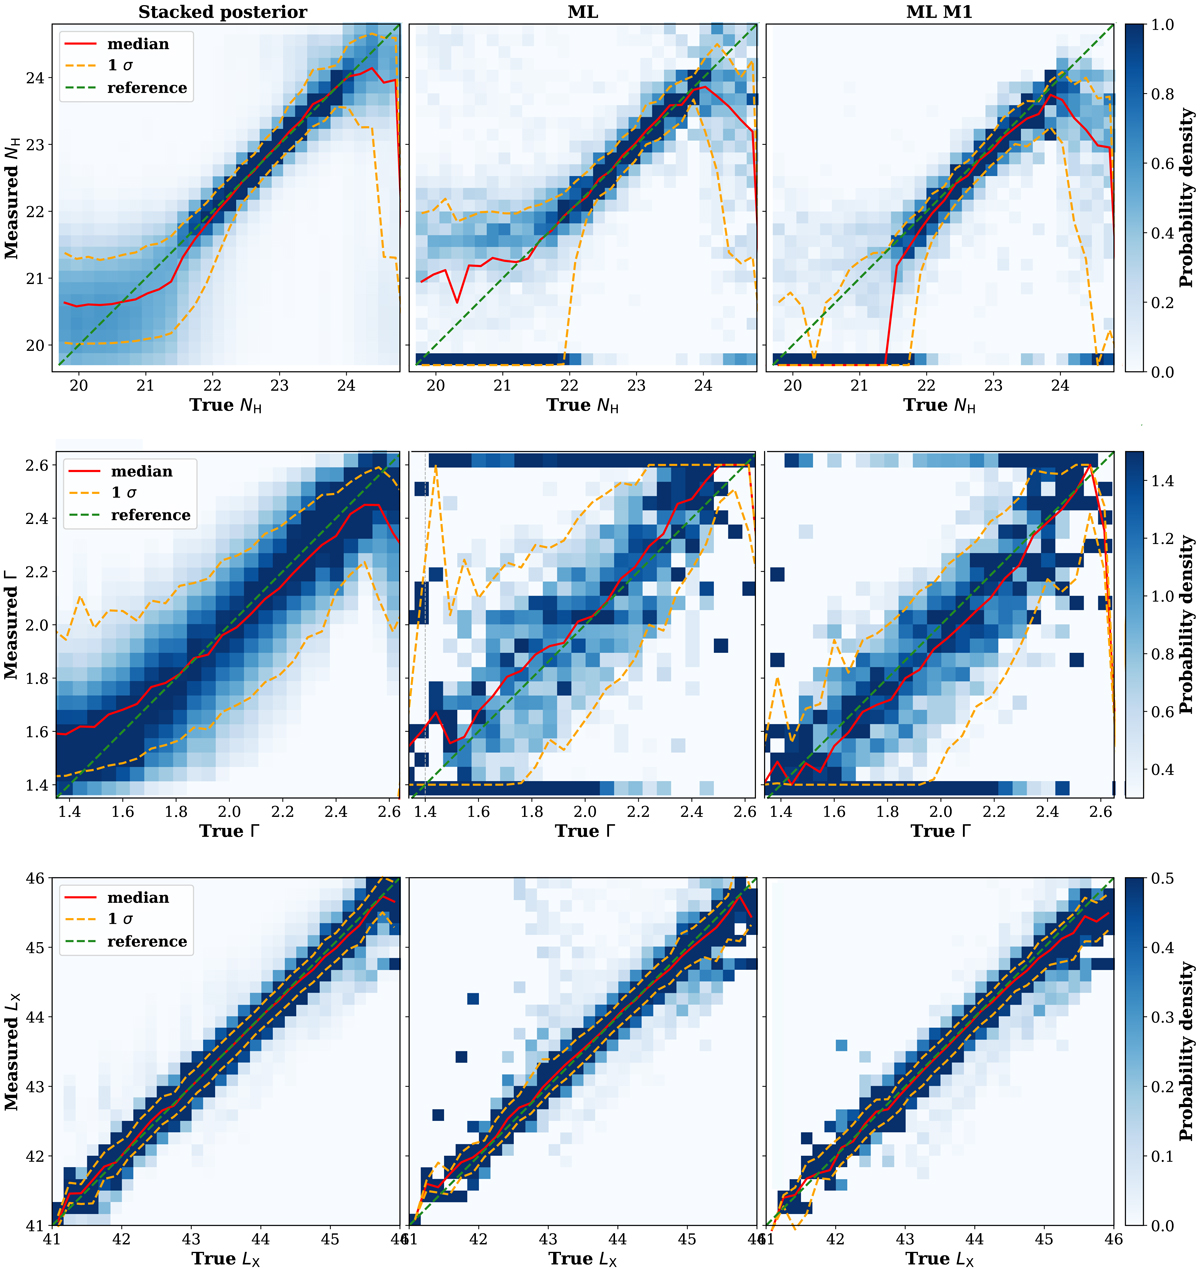
Stacked probability density plots of NH, Γ, and LX obtained with the different fitting approaches. Left column: Bayesian method. Middle: ML method. Right: M1 model. The true values are binned to 30 bins. The red line shows the medians of the distribution in each bin, and the dashed orange lines are the 16% and 84% percentiles. The dashed green line shows the reference where the fitted value equals the true one.
Current usage metrics show cumulative count of Article Views (full-text article views including HTML views, PDF and ePub downloads, according to the available data) and Abstracts Views on Vision4Press platform.
Data correspond to usage on the plateform after 2015. The current usage metrics is available 48-96 hours after online publication and is updated daily on week days.
Initial download of the metrics may take a while.