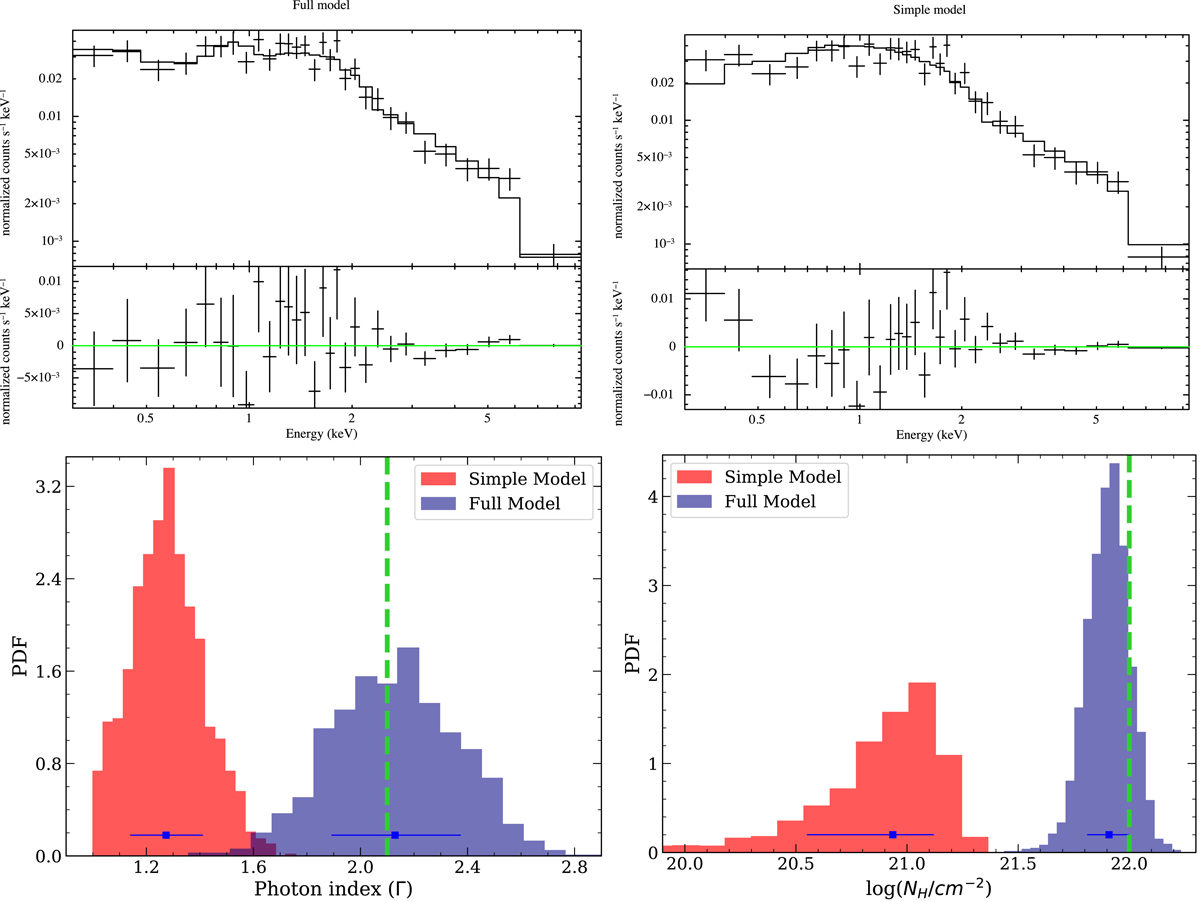
Fig. 2.
Download original image
Comparison between fits with models of different complexity. Top panels: best fit of a simulated spectrum using the full model (left) and the simple model (right). The residuals are plotted below. Bottom panels: posteriors of Γ (left) and NH (right) fitted with the full model (light purple) and the simple model (red). The dashed green lines show the input values. The blue points are medians of the posteriors with 68% credible intervals.
Current usage metrics show cumulative count of Article Views (full-text article views including HTML views, PDF and ePub downloads, according to the available data) and Abstracts Views on Vision4Press platform.
Data correspond to usage on the plateform after 2015. The current usage metrics is available 48-96 hours after online publication and is updated daily on week days.
Initial download of the metrics may take a while.