Fig. 11.
Download original image
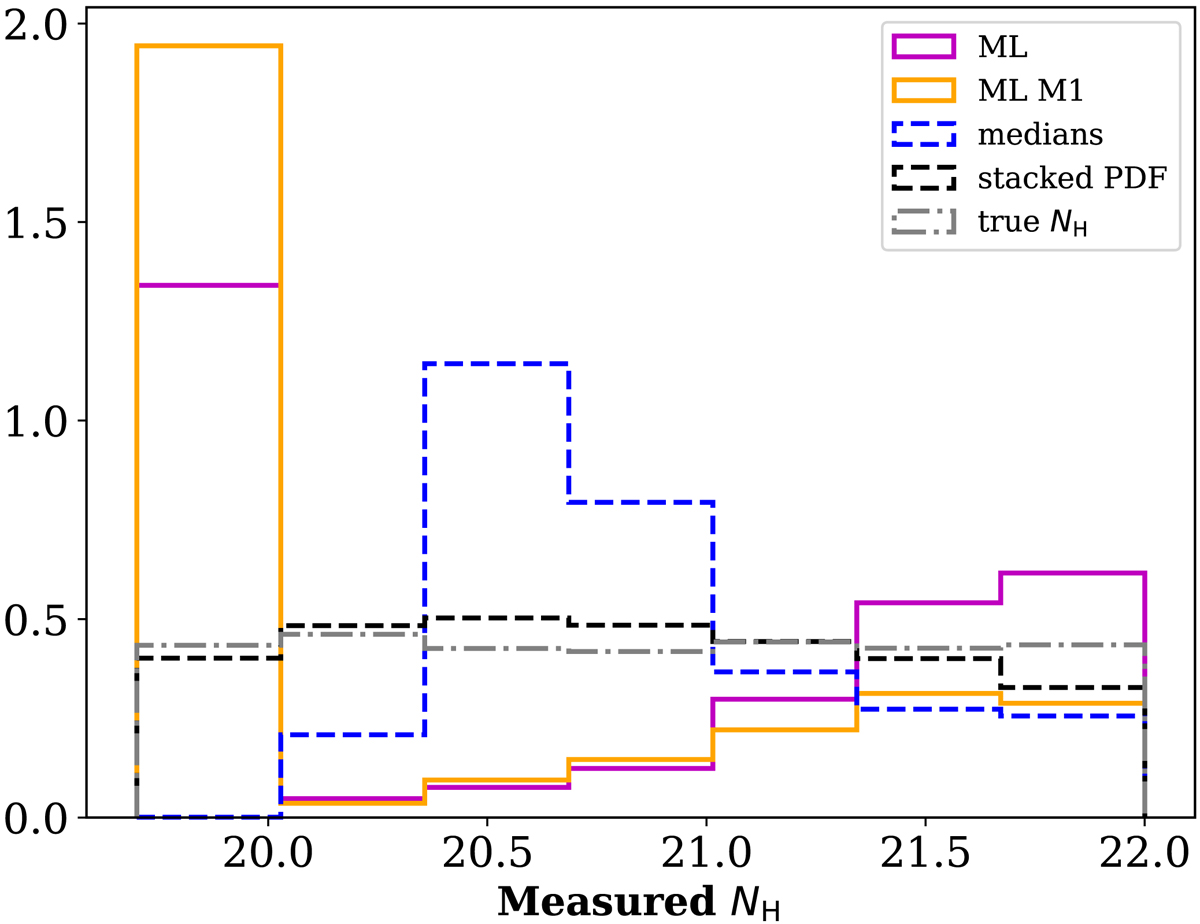
Distributions of NH in the unabsorbed subsample (NH < 1022 cm−2). The result with the ML approach using AICc selection is shown by the solid magenta line, and the approach using M1 alone is shown by the solid orange line. The results with the Bayesian method using medians and stacked PDF are shown by the dashed blue and black lines, respectively. The gray line shows the parent distribution.
Current usage metrics show cumulative count of Article Views (full-text article views including HTML views, PDF and ePub downloads, according to the available data) and Abstracts Views on Vision4Press platform.
Data correspond to usage on the plateform after 2015. The current usage metrics is available 48-96 hours after online publication and is updated daily on week days.
Initial download of the metrics may take a while.