Fig. 10.
Download original image
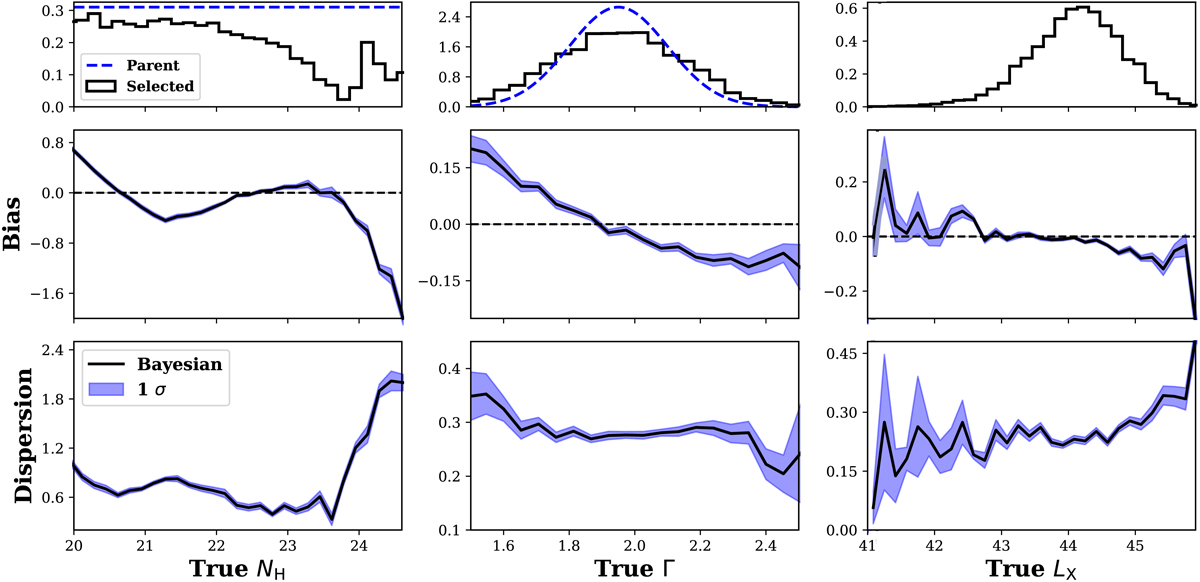
Parent distributions of NH, Γ, and LX (from left to right). Top row: parent distributions of the main parameters (dashed blue) compared to those after selection (black). The parent distribution of LX is not shown because it was computed based on other spectral parameters and then selected by the XLF (see Sect. 4.1). Middle and bottom rows: average bias and dispersion with 1σ uncertainties (blue area) of the Bayesian method with respect to the true values. In each bin we randomly drew one value from each PDF and then computed the bias and dispersion, and this procedure was repeated for 1000 times to obtain the average bias and dispersion, together with their uncertainties.
Current usage metrics show cumulative count of Article Views (full-text article views including HTML views, PDF and ePub downloads, according to the available data) and Abstracts Views on Vision4Press platform.
Data correspond to usage on the plateform after 2015. The current usage metrics is available 48-96 hours after online publication and is updated daily on week days.
Initial download of the metrics may take a while.