Fig. 8
Download original image
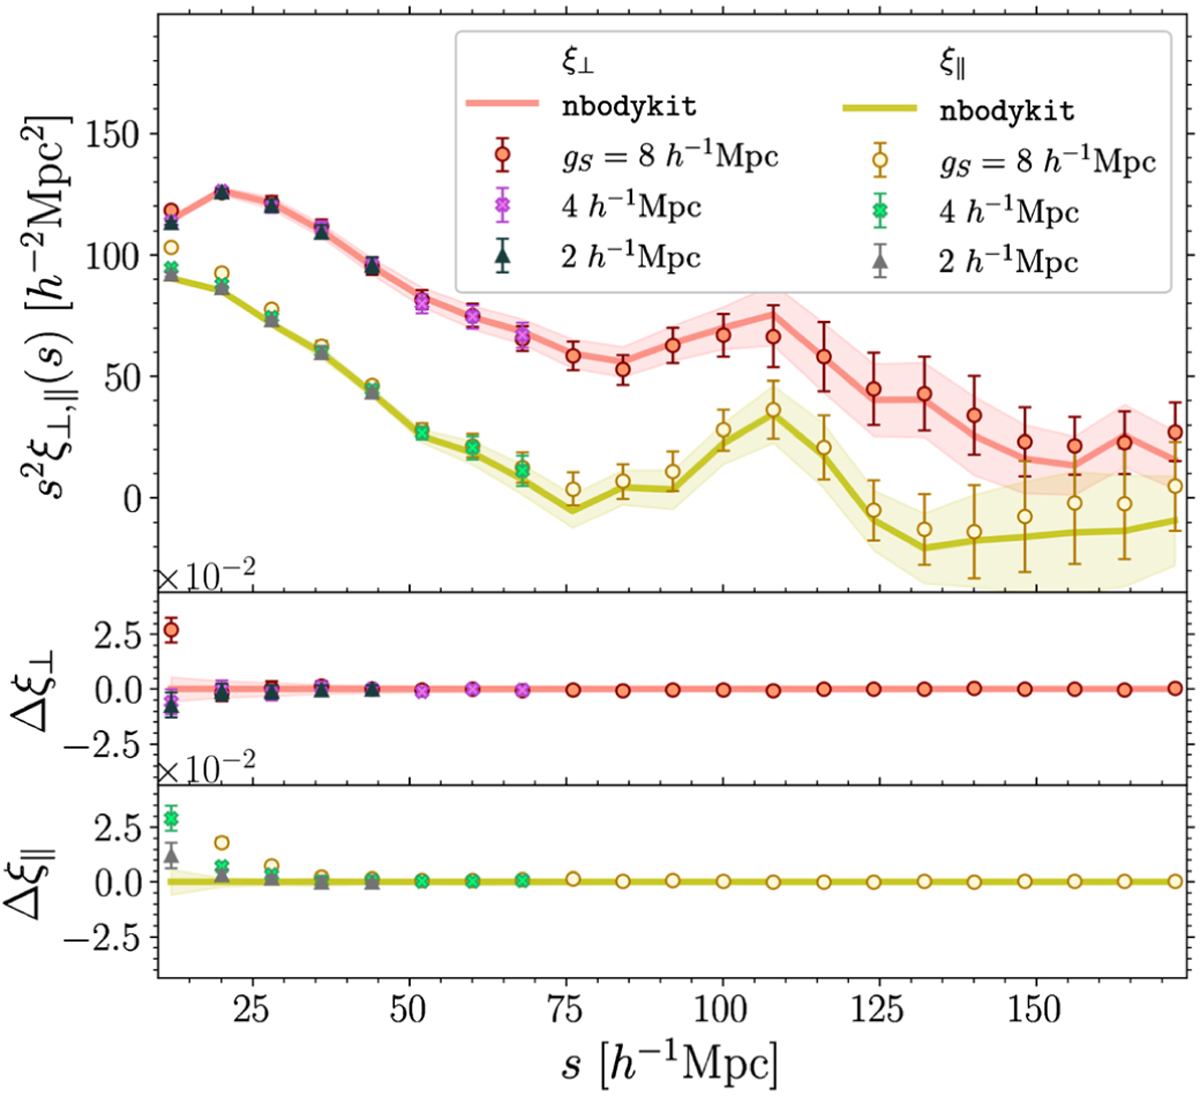
Points showing the transverse ξ⊥(s) and parallel ξ‖(s) components of the 2pcf computed using ConKer with three values of grid spacing gS = 8 (red–yellow), 4 (purple–green), 2 (black–grey) h−1 Mpc. Solid lines in the corresponding colors show the results from the nbodykit 2pcf algorithm. This figure corresponds only to NGC galaxies. The error bars and shaded regions are determined from the ensemble of Patchy mocks. The lower subpanels show the residual between the two methods.
Current usage metrics show cumulative count of Article Views (full-text article views including HTML views, PDF and ePub downloads, according to the available data) and Abstracts Views on Vision4Press platform.
Data correspond to usage on the plateform after 2015. The current usage metrics is available 48-96 hours after online publication and is updated daily on week days.
Initial download of the metrics may take a while.