Fig. 6
Download original image
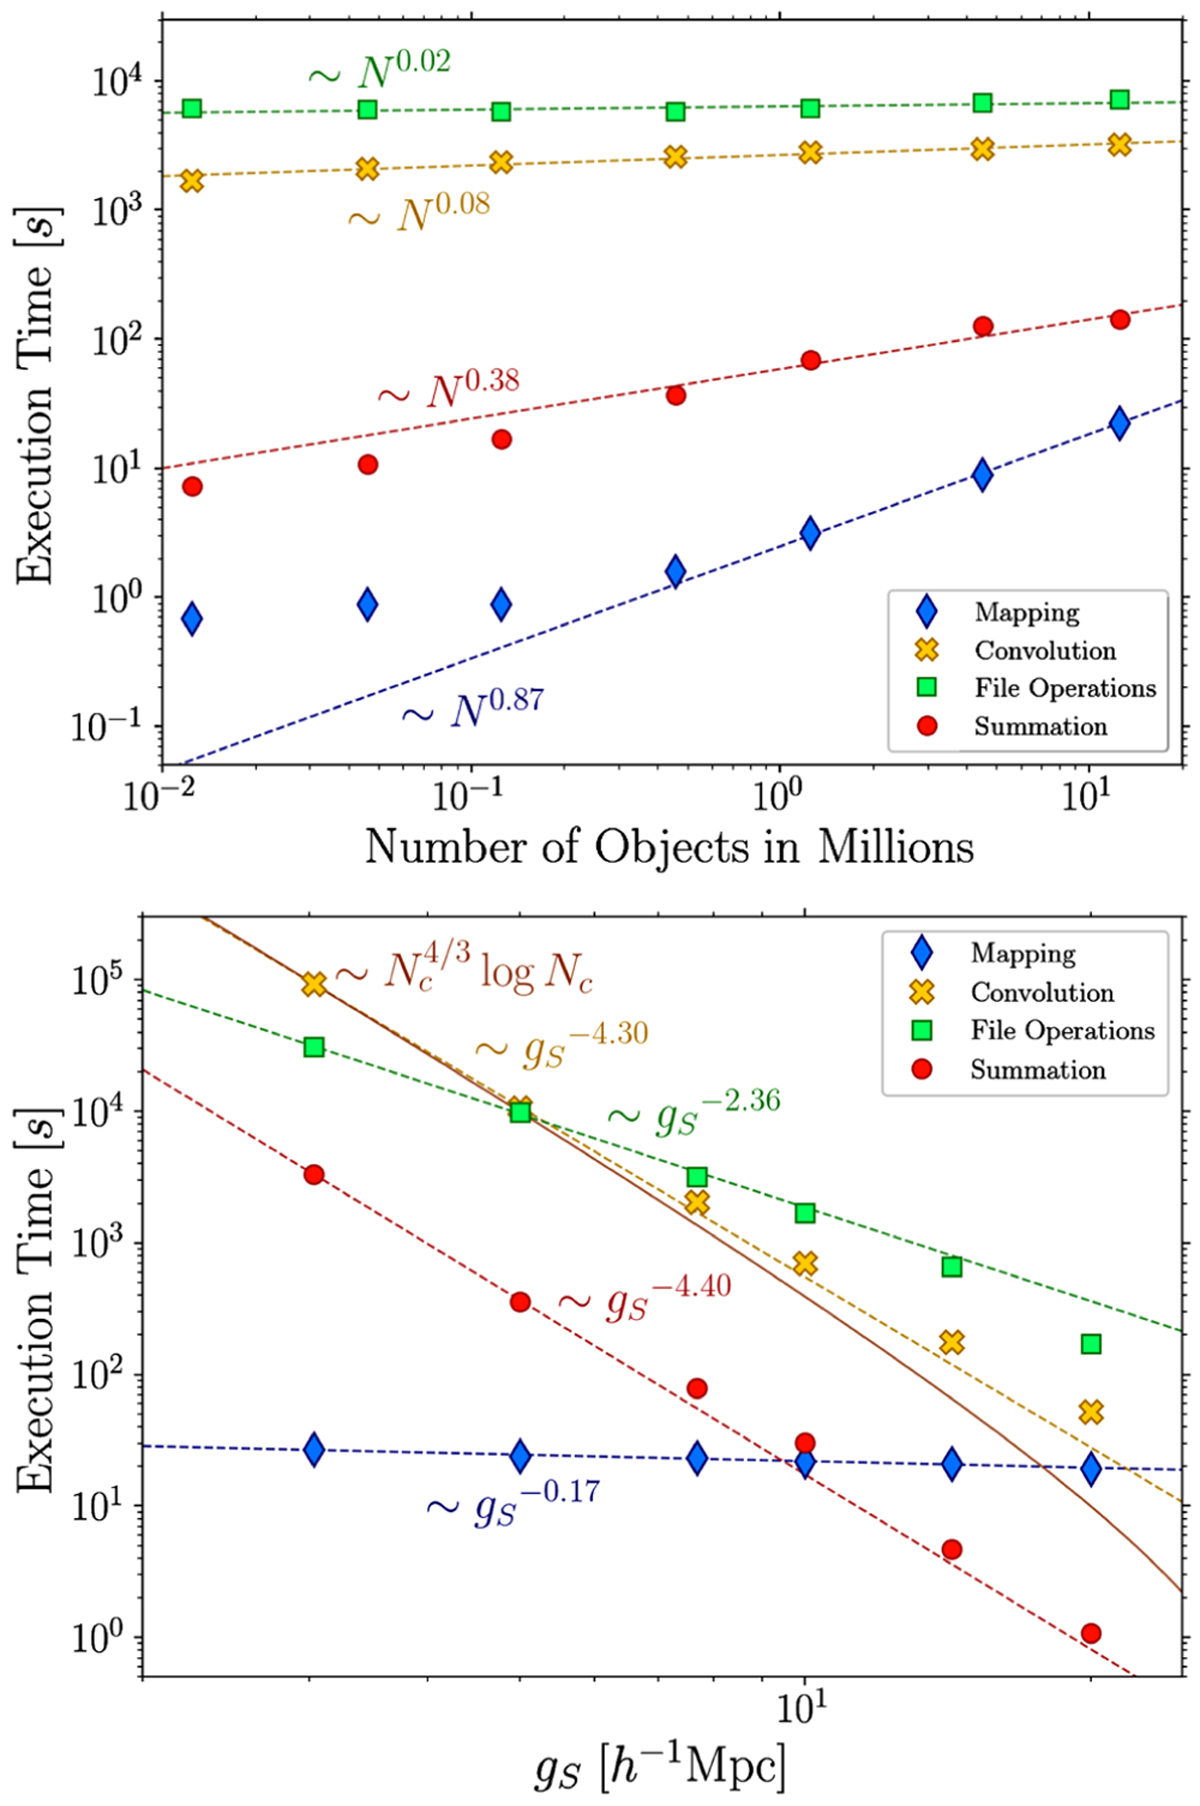
Execution time of the four processes in the ConKer algorithm, as applied to subsamples of the SDSS DR12 CMASS NGC galaxies (150° < αg < 210°, 0° < δg < 60°). Each point represents a calculation of the 2pcf (l = 0,2,4), 3pcf (l = 0–5), and diagonal npcf up to n = 5. Top: dependence on the number of combined data and random objects, using a grid resolution gS = 8 h−1 Mpc. Bottom: dependence on the grid resolution gS for 12.5M objects. The points represent the measured CPU time. The dashed lines are the results of the fit to a power law, with the scaling given in the figure. The solid line (bottom) is the time of the convolution step fit to ![]() .
.
Current usage metrics show cumulative count of Article Views (full-text article views including HTML views, PDF and ePub downloads, according to the available data) and Abstracts Views on Vision4Press platform.
Data correspond to usage on the plateform after 2015. The current usage metrics is available 48-96 hours after online publication and is updated daily on week days.
Initial download of the metrics may take a while.