Fig. 3.
Download original image
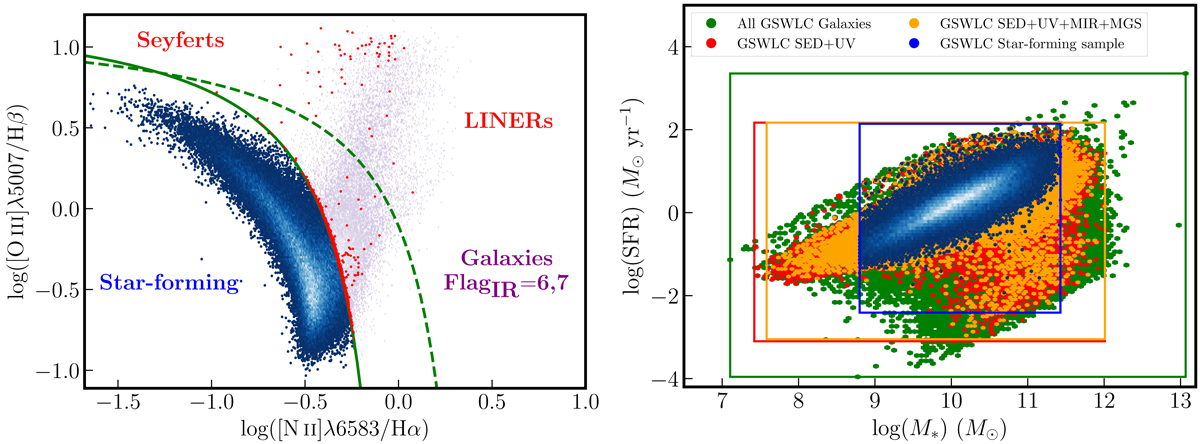
Distribution of GSWLC galaxies throughout the selection process. Left panel: BPT diagram for the sample of GSWLC galaxies. The separation between Seyfert and LINERS (red points), and star-forming galaxies (blue to white density plot) is represented by the green curve (Kauffmann et al. 2003), while the dashed-green line represents the limit from Kewley et al. (2001). Galaxies for which LTIR was corrected for AGN emission (and previously removed based on the GSWLC flags) are shown for information (purple to white density plot). Right panel: SFR versus M* for GSWLC galaxies for each selection: all GSWLC galaxies (green), selection on the quality of the fits, ![]() , and availability of GALEX measurements (red), selection on MIR measurements from which LTIR is not contaminated by the AGN component and belonging to the MGS (orange), and the star-forming sample (blue). Visible green, red, and orange points therefore represent galaxies excluded after each step. Rectangles represent the extent in SFR and M* after each selection.
, and availability of GALEX measurements (red), selection on MIR measurements from which LTIR is not contaminated by the AGN component and belonging to the MGS (orange), and the star-forming sample (blue). Visible green, red, and orange points therefore represent galaxies excluded after each step. Rectangles represent the extent in SFR and M* after each selection.
Current usage metrics show cumulative count of Article Views (full-text article views including HTML views, PDF and ePub downloads, according to the available data) and Abstracts Views on Vision4Press platform.
Data correspond to usage on the plateform after 2015. The current usage metrics is available 48-96 hours after online publication and is updated daily on week days.
Initial download of the metrics may take a while.