Fig. A.1.
Download original image
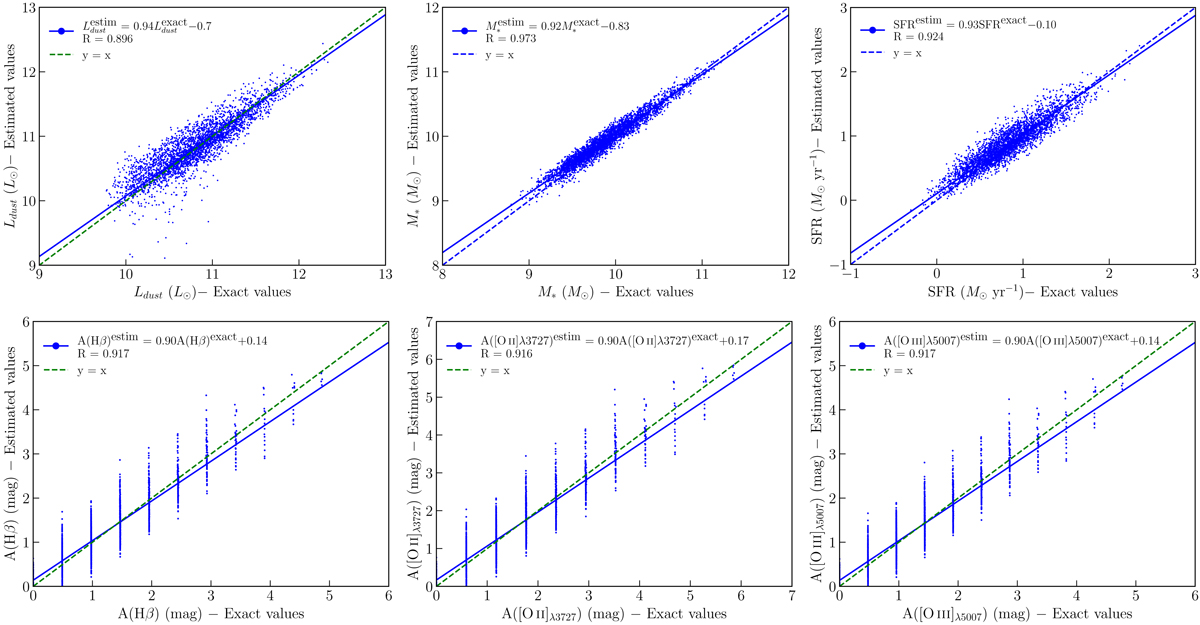
Mock analysis of the CIGALE run: parameters estimated by CIGALE versus exact parameters (top left: Ldust, top middle: M*, top right: SFR, bottom left: Hβ attenuation, bottom middle: [O II]λ3727 attenuation, bottom right: [O III]λ5007 attenuation. The blue lines and green lines represent the fit to the data and the one-to-one relation, respectively. The equation of the fit and the Pearson correlation coefficient R are indicated in each plot.
Current usage metrics show cumulative count of Article Views (full-text article views including HTML views, PDF and ePub downloads, according to the available data) and Abstracts Views on Vision4Press platform.
Data correspond to usage on the plateform after 2015. The current usage metrics is available 48-96 hours after online publication and is updated daily on week days.
Initial download of the metrics may take a while.