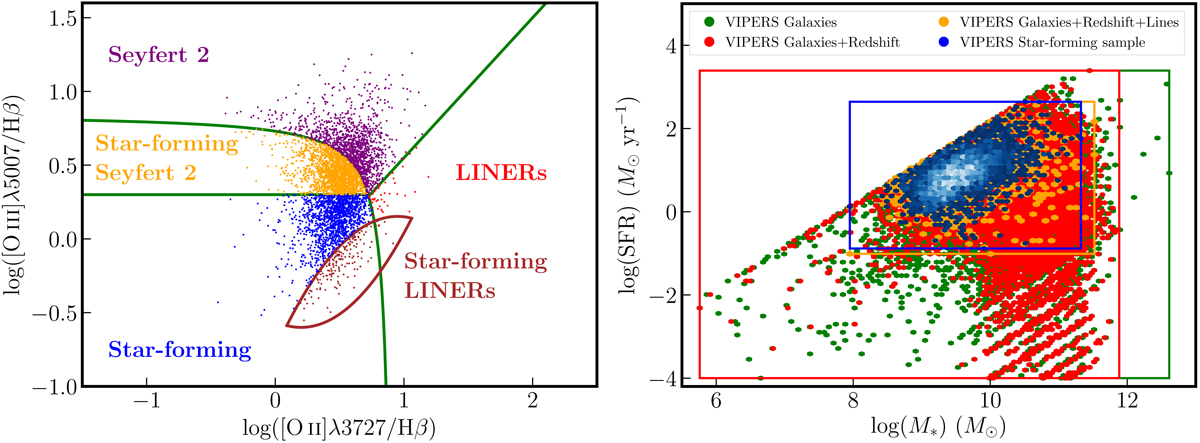
Fig. 2.
Download original image
Distribution of VIPERS galaxies throughout the selection process. Left panel: BPT diagram for the sample of VIPERS galaxies. Star-forming (blue), Star-forming/Seyfert 2 composite (yellow), and Seyfert 2 (purple) galaxies, and LINERs (red), and star-forming/LINERs composites (brown) are separated by green lines whose equations are given in Lamareille (2010). Right panel: SFR versus M* for VIPERS galaxies after each selection (SFR and M* are estimated using hyperz in this plot): all galaxies (green), selection on redshift (red), on lines (orange), and star-forming sample (blue). Visible green, red, and orange points therefore represent galaxies excluded after each selection. Rectangles represent the extent in SFR and M* after each selection.
Current usage metrics show cumulative count of Article Views (full-text article views including HTML views, PDF and ePub downloads, according to the available data) and Abstracts Views on Vision4Press platform.
Data correspond to usage on the plateform after 2015. The current usage metrics is available 48-96 hours after online publication and is updated daily on week days.
Initial download of the metrics may take a while.