Fig. 18.
Download original image
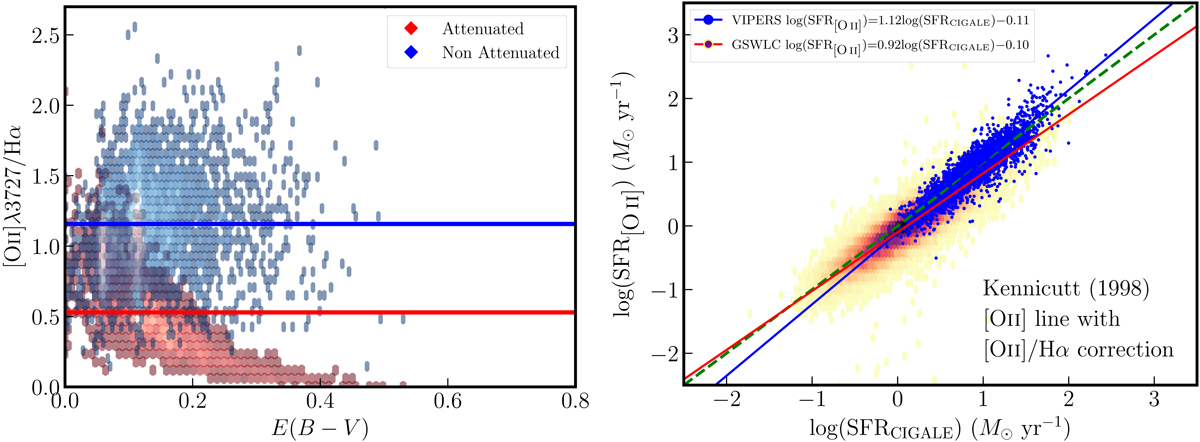
SFR derivation from [O II] using Kennicutt (1998) and a reddening correction. Left panel: [O II]/Hα ratio (assuming Hα = 2.86Hβ) as a function of the color excess, without (red) and with (blue) dust attenuation correction; the continuous lines represent the average ratio. Right panel: SFR derived from [O II] using the Hα calibration of Kennicutt (1998) and the attenuation-corrected [O II]/Hα ratio. For VIPERS and GSWLC, the slope increases in comparison with the direct [O II] calibration, but the scatter decreases (mean of 0.01 dex and scatter of 0.17 dex for VIPERS, 0.12 and 0.22 dex for GSWLC).
Current usage metrics show cumulative count of Article Views (full-text article views including HTML views, PDF and ePub downloads, according to the available data) and Abstracts Views on Vision4Press platform.
Data correspond to usage on the plateform after 2015. The current usage metrics is available 48-96 hours after online publication and is updated daily on week days.
Initial download of the metrics may take a while.