Fig. 16.
Download original image
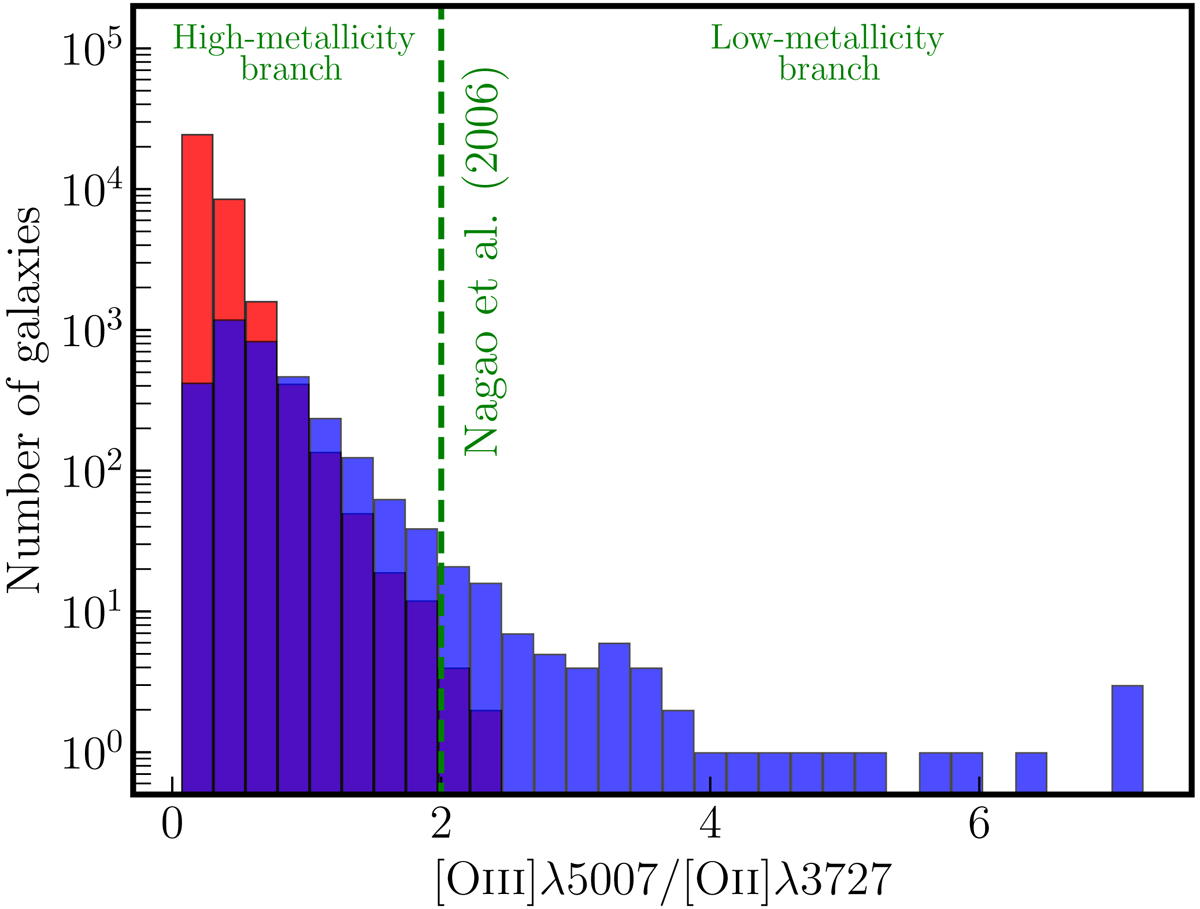
Histogram of [O III]λ5007/[O II]λ3727 for the GSWLC (red) and the VIPERS star-forming (blue) samples. The boundary between the lower and upper branch in the R23 diagnostic from Nagao et al. (2006) is shown as a dashed green line. Most of the galaxies are found on the high-metallicity branch (99.98% for GSWLC and 98% for VIPERS).
Current usage metrics show cumulative count of Article Views (full-text article views including HTML views, PDF and ePub downloads, according to the available data) and Abstracts Views on Vision4Press platform.
Data correspond to usage on the plateform after 2015. The current usage metrics is available 48-96 hours after online publication and is updated daily on week days.
Initial download of the metrics may take a while.