Fig. 10.
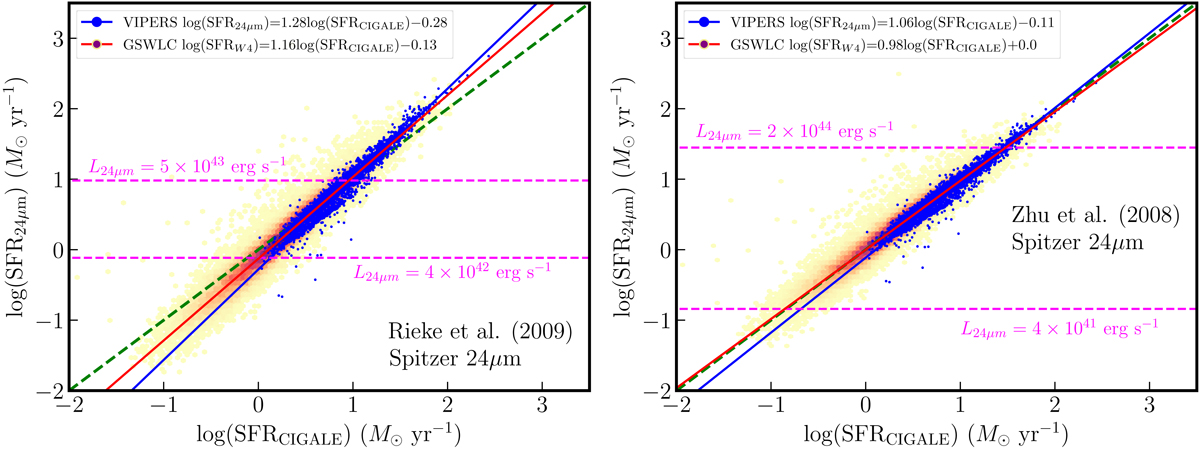
Download original image
Comparisons between the SFR from CIGALE and the literature at 24 μm. Left panel: SFR derived from the relations given in Rieke et al. (2009) using Spitzer 24 μm from CIGALE (blue). The continuous magenta line represents the limit above which a nonlinear correction is used. Right panel: SFR derived from the relations given in Zhu et al. (2008) using Spitzer 24 μm. The dashed magenta lines represent the domain of applicability, as defined by Calzetti et al. (2010). The small discrepancy observed using Rieke et al. (2009) (mean of 0.004 dex and scatter of 0.13 dex for VIPERS, 0.07 and 0.16 dex for GSWLC) may originate from the hypothesis of linearity (the nonlinearity correction for Rieke et al. (2009) is small), while a nonlinear calibration such as Zhu et al. (2008) gives a better agreement (mean of 0.04 dex and scatter of 0.08 dex for VIPERS, 0.01 and 0.12 dex for GSWLC).
Current usage metrics show cumulative count of Article Views (full-text article views including HTML views, PDF and ePub downloads, according to the available data) and Abstracts Views on Vision4Press platform.
Data correspond to usage on the plateform after 2015. The current usage metrics is available 48-96 hours after online publication and is updated daily on week days.
Initial download of the metrics may take a while.