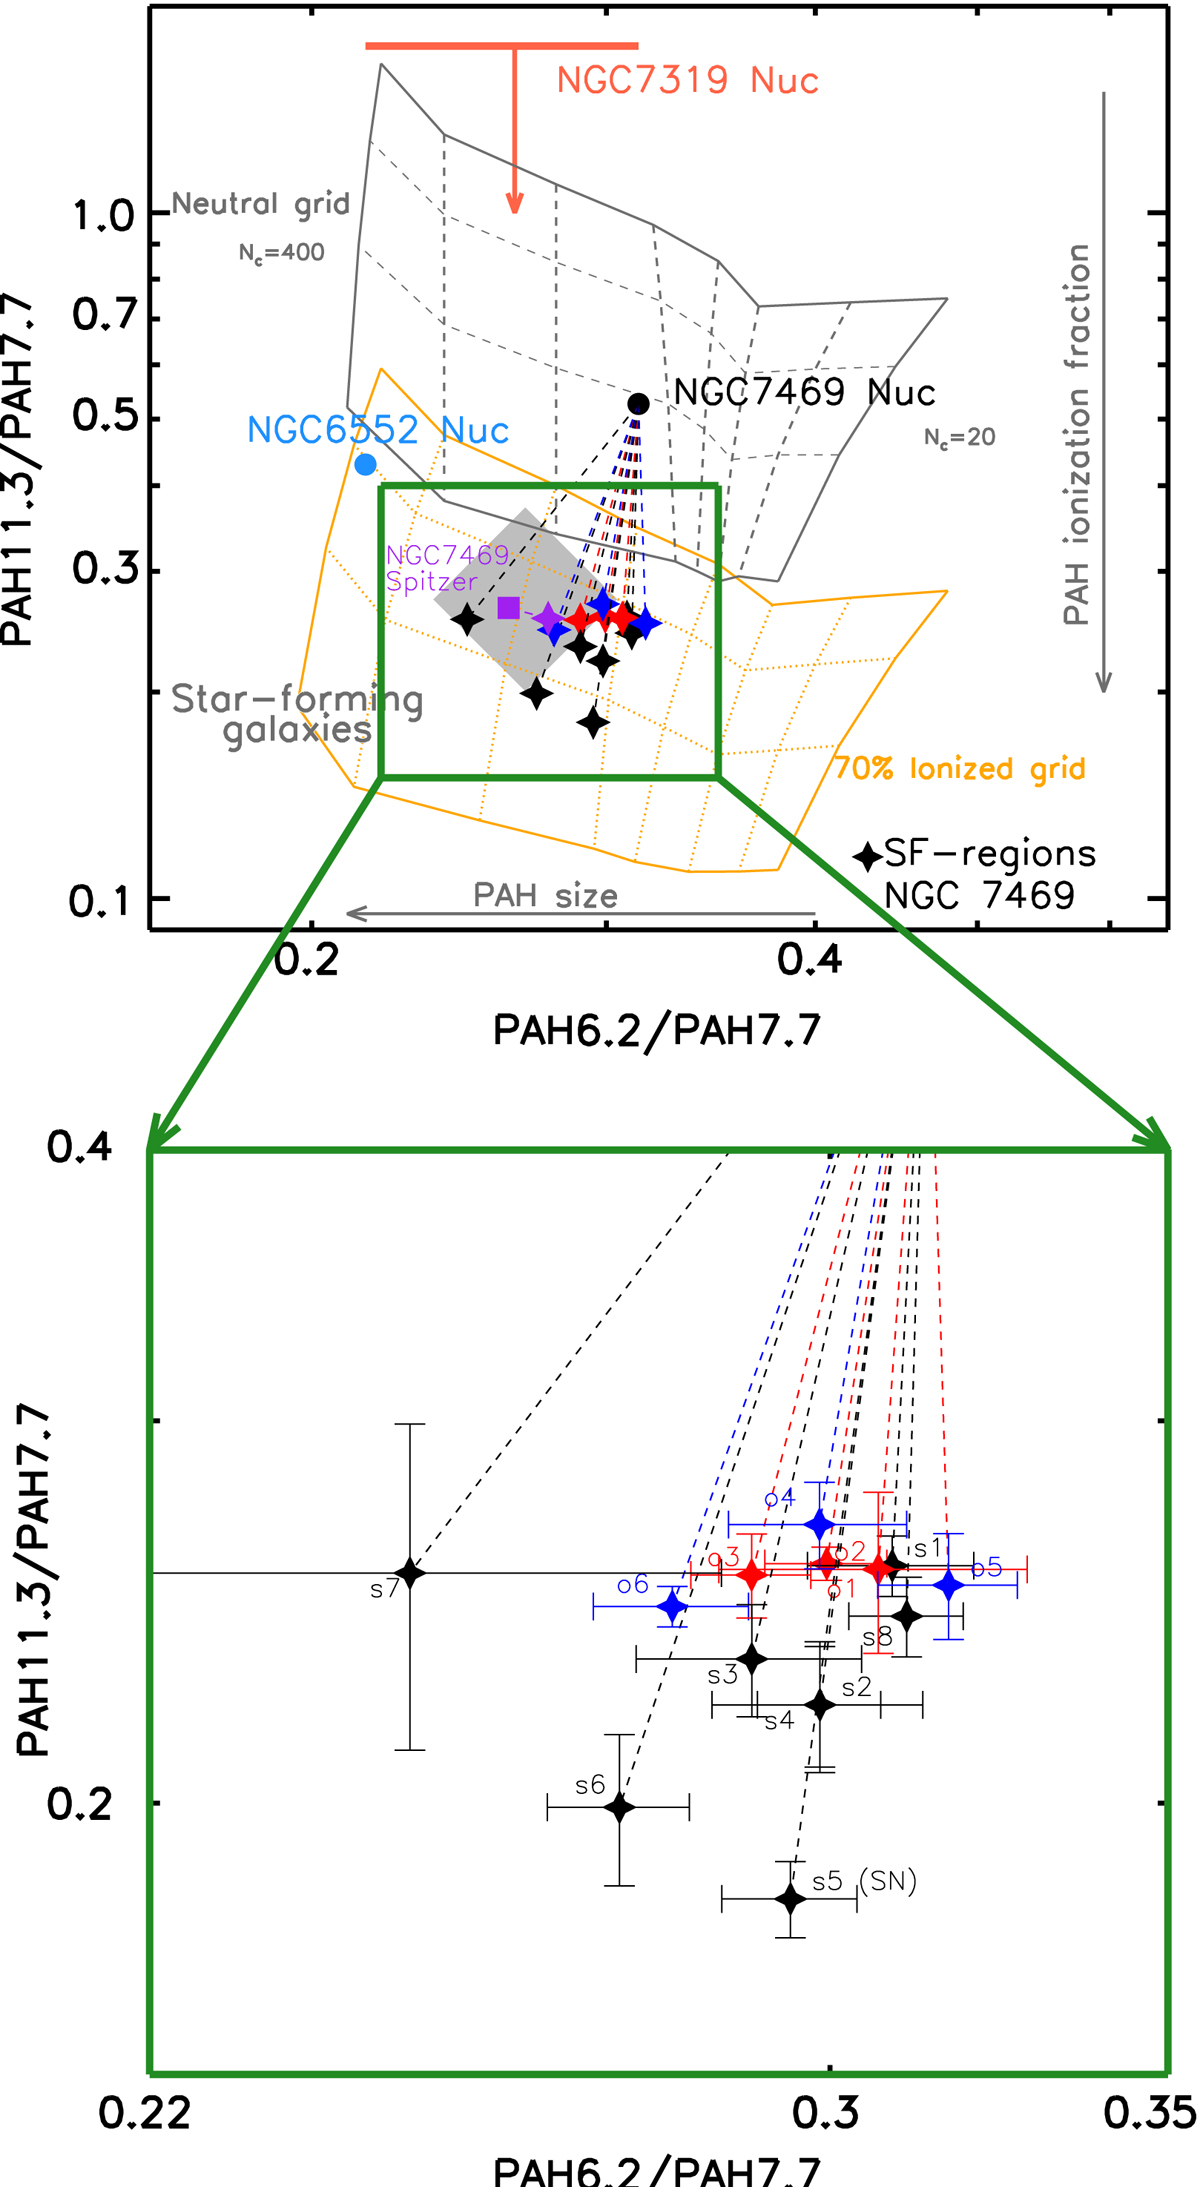
Fig. 4.
Download original image
PAH diagnostic diagram. Top panel: relative strengths of the 6.2, 7.7, and 11.3 μm PAH features for NGC 6552 (light blue circle), NGC 7319 (solid orange line), and NGC 7469 (black circles). Filled stars correspond to the circumnuclear emission of NGC 7469 (coloured stars correspond to the SF regions discussed in Sect. 3.2). The purple points correspond to PAH ratios of NGC 7469 derived from Spitzer/IRS. The grey shaded region denotes the average location of SF galaxies from García-Bernete et al. (2022) using Spitzer/IRS data. The grey grid corresponds to neutral PAHs ranging from small PAHs (NC = 20; right side of the grid) to large PAH molecules (NC = 400; left side of the grid). Dashed grey lines correspond to intermediate numbers of carbons. The orange grid corresponds to 70% of ionised PAH molecules for the same number of carbons as the neutral grid. Dotted orange lines correspond to intermediate numbers of carbons. The nuclear points are more consistent with neutral PAH grids. Bottom panel: zoomed-in view of the green box in the top panel.
Current usage metrics show cumulative count of Article Views (full-text article views including HTML views, PDF and ePub downloads, according to the available data) and Abstracts Views on Vision4Press platform.
Data correspond to usage on the plateform after 2015. The current usage metrics is available 48-96 hours after online publication and is updated daily on week days.
Initial download of the metrics may take a while.