Fig. 3.
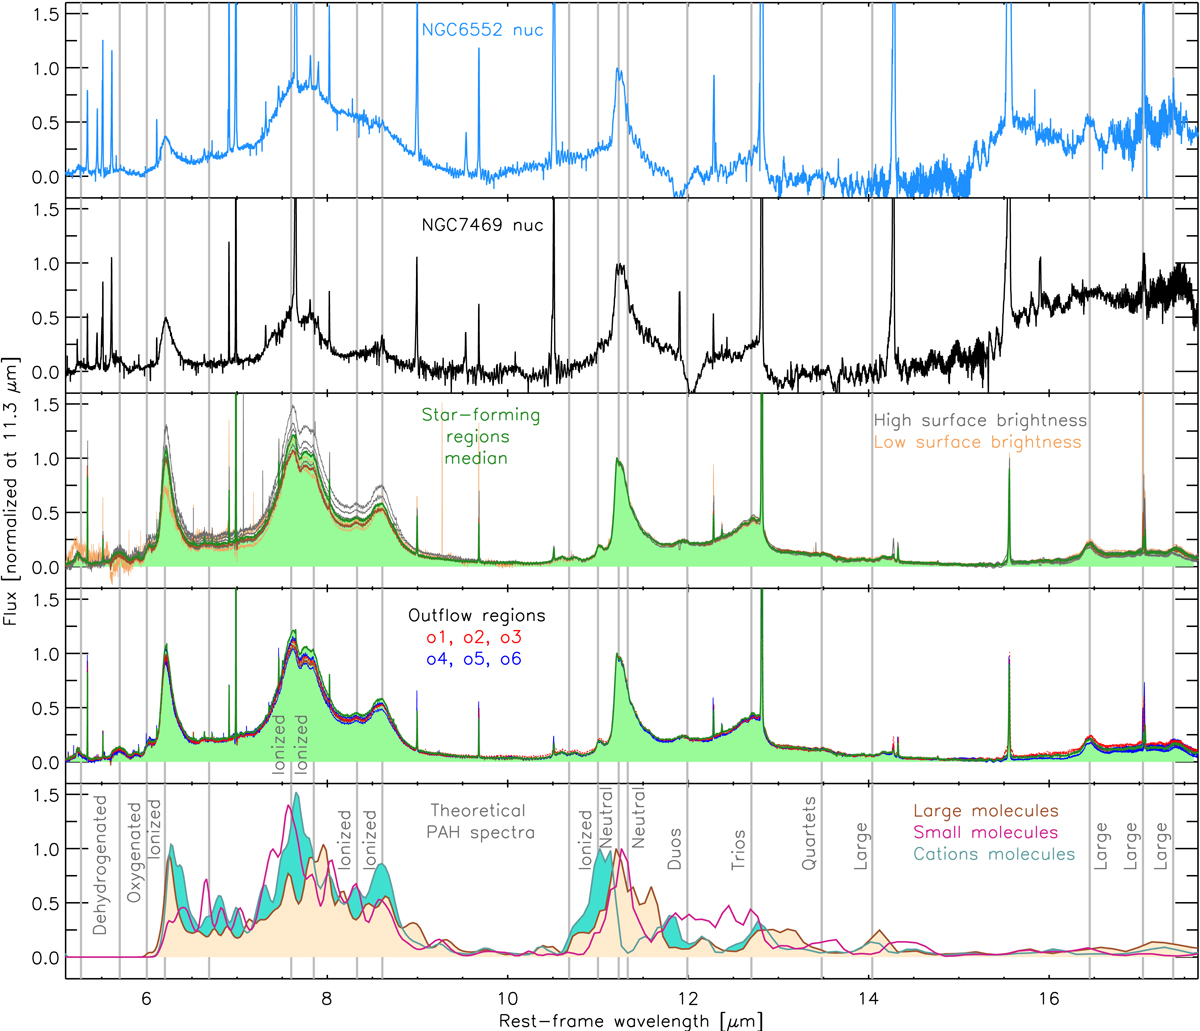
Download original image
Continuum-subtracted spectra showing the PAH emission together with the fine-structure lines. First two panels: correspond to the nuclear spectra of NGC 6552 and NGC 7469, respectively (see Appendix C for a comparison with the PAH residual spectra of NGC 7319). Central panel: corresponds to the circumnuclear regions of NGC 7469 (solid grey lines) and the median circumnuclear spectra of high and low surface brightness regions (solid green and brown lines, respectively). Fourth panel: comparison between the median NGC 7469 circumnuclear spectrum and the regions located in the potential outflow zones (blue and red lines). Bottom panel: synthetic PAH spectral templates of large (100 < Nc < 400), small (20 < Nc < 100), and ionised PAH molecules from Rigopoulou et al. (2021). All the spectra are normalised at 11.3 μm.
Current usage metrics show cumulative count of Article Views (full-text article views including HTML views, PDF and ePub downloads, according to the available data) and Abstracts Views on Vision4Press platform.
Data correspond to usage on the plateform after 2015. The current usage metrics is available 48-96 hours after online publication and is updated daily on week days.
Initial download of the metrics may take a while.