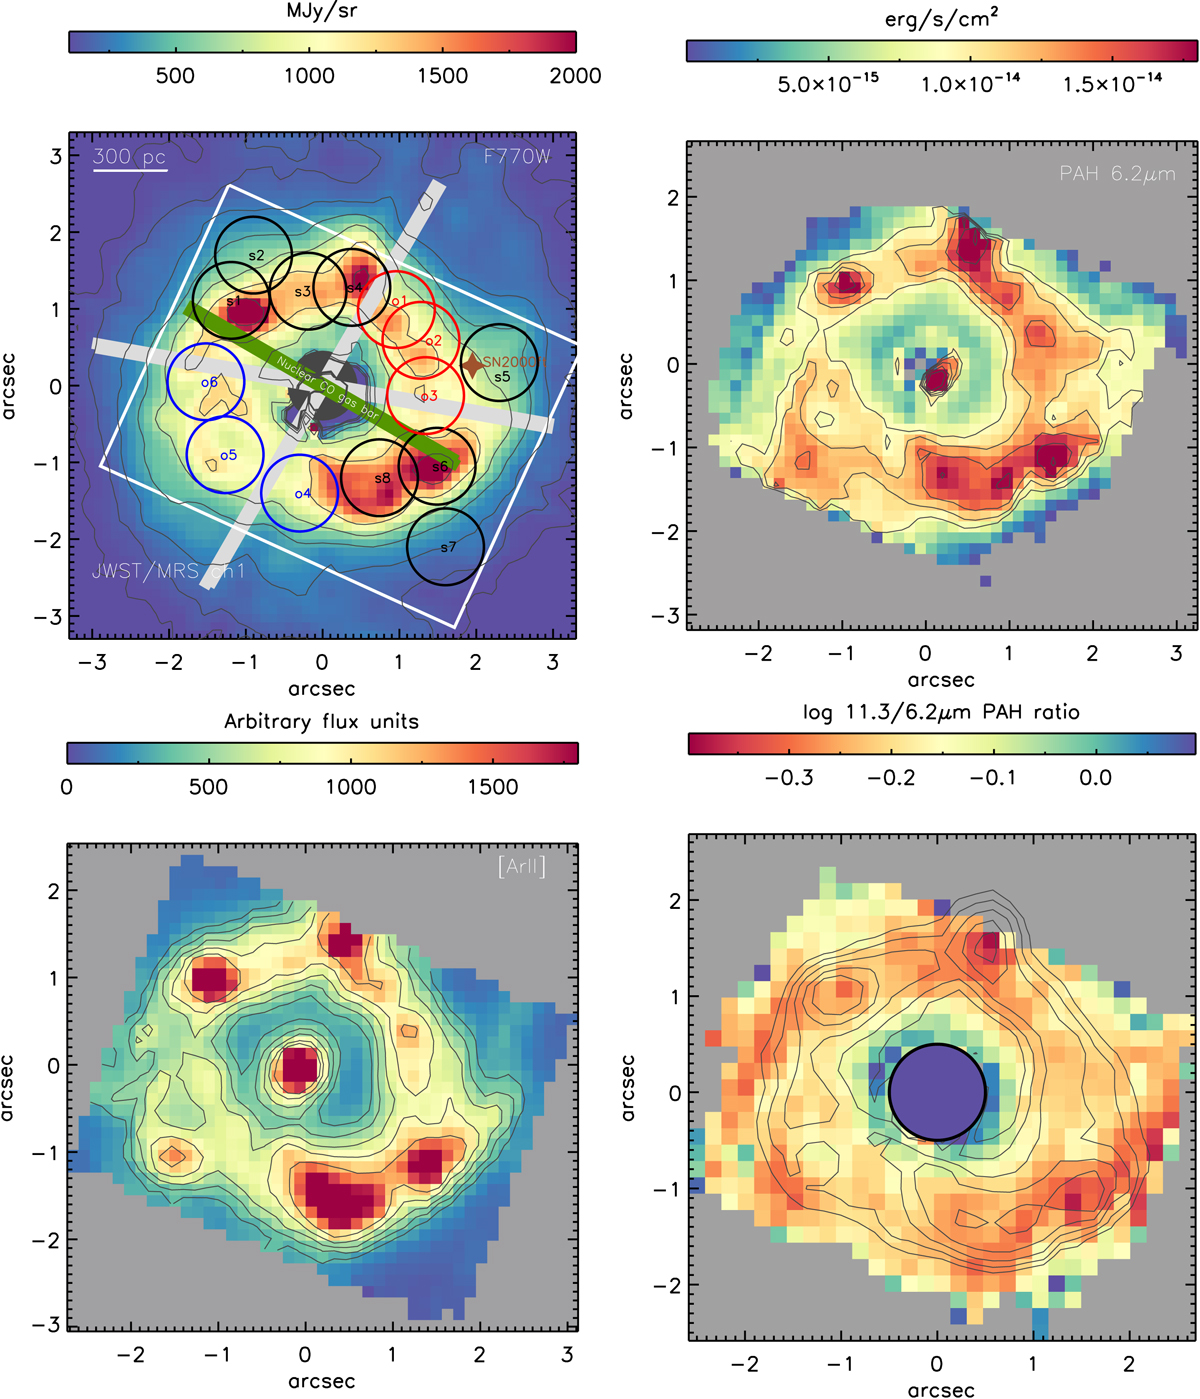
Fig. 2.
Download original image
Maps of the central ∼6″ region of NGC 7469, which includes the AGN and the circumnuclear ring of star formation. Top-left panel: in colour and black contours is the JWST/F770W PSF-subtracted image (which mainly traces the 7.7 μm PAH band). Black regions (s1, s2, s3, s4, s5, s6, and s7) correspond to selected circumnuclear zones of NGC 7469. Red and blue regions (o1, o2, o3, o4, o5, and o6) are in the outflow region. The green line represents the orientation of the nuclear molecular gas bar. The grey lines correspond to the approximate outflow region according to the [S IV]λ10.51 μm velocity map (see Appendix B). The white box represents the JWST/MRS ch1 FoV (3.2″ × 3.7″), which is practically identical to the Spitzer/IRS angular resolution. The brown star corresponds to the approximate location of the radio supernova SN 2000ft (Colina et al. 2001). Top-right panel: JWST/MRS 6.2 μm PAH band map derived using a local continuum (see text). Bottom-left panel: [Ar II]λ6.99 μm emission map. Bottom-right panel: 11.3/6.2 μm PAH ratio using local continua (see text). In black are the 6.2 μm PAH band contours. The central region corresponds to this PAH ratio in the nuclear spectrum. All the images are shown on a linear colour scale. North is up and east is to the left, and offsets are measured relative to the AGN.
Current usage metrics show cumulative count of Article Views (full-text article views including HTML views, PDF and ePub downloads, according to the available data) and Abstracts Views on Vision4Press platform.
Data correspond to usage on the plateform after 2015. The current usage metrics is available 48-96 hours after online publication and is updated daily on week days.
Initial download of the metrics may take a while.