| Issue |
A&A
Volume 666, October 2022
|
|
|---|---|---|
| Article Number | A177 | |
| Number of page(s) | 7 | |
| Section | Galactic structure, stellar clusters and populations | |
| DOI | https://doi.org/10.1051/0004-6361/202244613 | |
| Published online | 24 October 2022 | |
Multiple stellar populations in the high-temperature regime: Potassium abundances in the globular cluster M 54 (NGC 6715)⋆
INAF-Osservatorio di Astrofisica e Scienza dello Spazio di Bologna, Via Gobetti 93/3, 40129 Bologna, Italy
e-mail: This email address is being protected from spambots. You need JavaScript enabled to view it.
Received:
28
July
2022
Accepted:
5
September
2022
Abstract
Among the multiple stellar populations in globular clusters (GCs) the very high-temperature H-burning regime, able to produce elements up to potassium, is still poorly explored. Here we present the first abundance analysis of K in 42 giants of NGC 6715 (M 54) with homogeneous abundances of light elements previously derived in our FLAMES survey. Owing to the large mass and low metallicity, a large excess of K could be expected in this GC, which is located in the nucleus of the Sagittarius dwarf galaxy. We actually found a spread in [K/Fe] spanning about 1 dex, with [K/Fe] presenting a significant anti-correlation with [O/Fe] ratios, regardless of the metallicity component in M 54. Evidence for a K–Mg anti-correlation also exists, but this is statistically marginal because of the lack of very Mg-poor stars in this GC. We found, however, a strong correlation between K and Ca. These observations clearly show that the K enhancement in M 54 is probably due to the same network of nuclear reactions generating the phenomenon of multiple stellar populations, at work in a regime of very high temperature. The comparison with recent results in ω Cen is hampered by an unexplained trend with the temperatures for K abundances from optical spectroscopy, and somewhat by a limited sample size for infrared APOGEE data. There are few doubts, however, that the two most massive GCs in the Milky Way host a K–Mg anti-correlation.
Key words: stars: abundances / stars: atmospheres / stars: Population II / globular clusters: general / globular clusters: individual: NGC 6715
Based on observations collected at ESO telescopes under programmes 081.D-0286 and 095.D-0539.
© E. Carretta 2022
 Open Access article, published by EDP Sciences, under the terms of the Creative Commons Attribution License (https://creativecommons.org/licenses/by/4.0), which permits unrestricted use, distribution, and reproduction in any medium, provided the original work is properly cited.
This article is published in open access under the Subscribe-to-Open model. This email address is being protected from spambots. You need JavaScript enabled to view it. to support open access publication.
1. Introduction
Multiple stellar populations in globular clusters (GCs) are defined as groups of stars that are distinct by differences in light elements (mainly C, N, O, Na, Mg, Al, and Si) within stellar systems generally showing a very homogeneous chemical composition. Since these variations are found at every evolutionary stage and the currently observed low-mass stars in GCs cannot produce the species found enhanced in GC stars, the changes must have been imprinted in the proto-cluster gas by self-enrichment from polluters of an early first generation (FG; see Gratton et al. 2001). These still unknown actors, being more massive, went extinct, leaving at least a second generation (SG) of stars, whose fossil record is accessible through direct observations.
The different chemistry of multiple stellar populations can be directly studied through abundance analysis with low- and high-resolution spectroscopy, or through the effect of varying chemical composition on photometric sequences of GCs observed in a variety of filters, with bandpasses including features of the light elements. Despite the efforts of systematic spectroscopic surveys (such as our FLAMES survey: Carretta et al. 2006, 2009a,b, 2010a and further developments) and photometric surveys (e.g., Lardo et al. 2011; Monelli et al. 2013; Nardiello et al. 2018), a precise identification of the objects responsible for early enrichment of GCs is still elusive, and the comparison of observation and theory is still plagued by unsolved problems (see e.g., the review by Bastian & Lardo 2018 and Gratton et al. 2019).
The nature of the involved process is, however, rather well assessed. For a long time (see the reviews by Smith 1987 and Gratton et al. 2004), the well defined pattern of anti-correlations and correlations among the light elements has been recognised as the action of proton-capture reactions in H-burning at high temperatures (e.g., Denisenkov & Denisenkova 1989). What makes it problematic to isolate a single candidate FG polluter is the variety of stellar objects able to reach the necessary temperature for the nuclear burning required to deplete C, O, and Mg, simultaneously elevating the levels of N, Na, Al, and Si, as observed in GC stars. Therefore, it is crucial to gather observational material on those poorly studied species, such as potassium, which are produced only in presence of very high temperatures (above 180 million K: Iliadis et al. 2016; Prantzos et al. 2017), together with more extensively investigated species such as Na and Al. The simultaneous presence of excesses in K and other species that should have been destroyed at such high temperatures may exacerbate problems in the theoretical models, or even falsify some of the proposed scenarios for early self-enrichment in GCs.
Vice versa, playing with the different chemical species produced or destroyed in different conditions, we can hope to pinpoint the temperature (i.e., the mass) range allowed for potential polluters. A classical example is the abundance analysis in NGC 6388 (Carretta & Bragaglia 2019). In this massive bulge GC, we found that Mg is not anti-correlated to either Ca or Sc (at odds, e.g., with NGC 2808). On the other hand, a clear Mg–Si anti-correlation is observed, fixing a lower limit at 65 million K, which is the temperature required for a significant leakage from the Mg–Al cycle on Si (Arnould et al. 1999). The inference that the central temperature of the FG polluters was comprised in a limited range of values (∼100 − 150 MK or 110 − 120 MK, depending on the selected class) then follows.
A systematic census of excesses in Ca and Sc in about a half of the GCs in the Milky Way was carried out in Carretta & Bragaglia (2021) using unpolluted field stars as a comparison sample. We detected statistically significant variations related to proton-capture processes at very high temperatures in eight GCs out of 77 examined. Ca and Sc are usually well studied species for many stars in many GCs, but the direct litmus test would be retrieving correlations and anti-correlations involving K, which unfortunately is much less investigated. A situation we are helping to somewhat alleviate in the present paper, which is organised as follows.
After a brief excursus on previous abundance analyses of K abundances in GCs and a discussion on the potential targets (Sect. 2), we illustrate observations and analysis (Sect. 3), and results (Sect. 4) for NGC 6715 (M 54), the nuclear star cluster associated with the disrupting dwarf galaxy, Sagittarius. We summarise our findings in Sect. 5.
2. Target and comparison clusters
In Carretta et al. (2014, their Fig. 15), we introduced a diagnostic plot to select candidate GCs where the very high-temperature regime was probably at work. Using more than 200 stars in several GCs observed at high resolution with the UVES spectrograph as a reference baseline, we plotted the [Ca/Mg] ratio as a function of [Ca/H]. The idea was to pick up candidate stars with larger than average excesses of Ca or depletions in Mg (or a combination of the two). In particular conditions it is predicted that the consumption of Mg may bypass the usual production of Al to reach heavier nuclei, starting from nuclei of Ar (Ventura et al. 2012). The scanty observations that existed at the time confirmed significant correlations among Ca, Sc, and K abundances in NGC 2419 (Cohen & Kirby 2012; Mucciarelli et al. 2012; Carretta et al. 2013a), suggesting that their excesses probably originated from the same source.
An update of that diagnostic plot is provided in Fig. 1. In the left and central panels, we highlight the GCs scrutinised so far to explore the high-temperature regime of multiple populations, with particular attention to K abundances. In the left panel of Fig. 1, NGC 2808 (black squares) stands out, with high values of the [Ca/Mg] ratios due to the significant anti-correlation between Ca and Mg stressed by Carretta (2015), together with a correlation between Ca and Sc. The addition of K (Mucciarelli et al. 2015) completes the set of heavy proton-capture elements studied in this GC. Red squares indicate NGC 4833, where K abundances and related correlations were studied by Roederer & Thompson (2015) and, more extensively, by Carretta (2021). Blue squares are for NGC 6809 where Mucciarelli et al. (2017) found marginal evidence for a [K/Fe]–[O/Fe] anti-correlation, compatible with the solitary star with a high [Ca/Mg] ratio in the left panel of Fig. 1. Finally, high [Ca/Mg] ratios are seen in stars of ω Cen (from Norris & Da Costa 1995, orange triangles), strongly suggesting that the most massive GC in the Galaxy is a very promising candidate where one can look for large variations also in K.
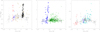 |
Fig. 1. Abundance ratios of [Ca/Mg] as a function of [Ca/H] in several GCs. In all three panels the empty squares indicate stars with UVES spectra in our FLAMES survey from Carretta et al. (2010b, 2009b, 2010c, 2011, 2013b, 2014, 2015). In each panel a few GCs are highlighted. Left panel: NGC 4833 (Carretta et al. 2014, red squares), NGC 6809 (Carretta et al. 2010b, 2009b: blue squares), NGC 2808 (Carretta 2015: black squares), and NGC 5139 (ω Cen, Norris and Da Costa 1995: orange triangles). Middle panel: NGC 2419 (Cohen & Kirby 2012; Mucciarelli et al. 2012: blue circles) and ω Cen from APOGEE infrared data (Mészáros et al. 2020, green triangles). Right panel: NGC 7078 (M 15: Carretta et al. 2010b, 2009b: red squares), NGC 1904 (Carretta et al. 2010b, 2009b: black squares), NGC 6093 (M 80: Carretta et al. 2015: magenta squares), and NGC 6715 (M 54: Carretta et al. 2010c: cyan squares). The different vertical scale in all panels should be noted. |
This is strengthened by the middle panel in Fig. 1, where we plot the [Ca/Mg] ratios in ω Cen from the APOGEE infrared data (Mészáros et al. 2020, green triangles) together with the abundances in NGC 2419 (Cohen & Kirby 2012; Mucciarelli et al. 2012). Again, it seems promising to look at ω Cen, although the remarkable values shown by NGC 2419 are far to be reached.
A recent analysis of K in ω Cen from optical spectra (Alvarez Garay et al. 2022; hereinafter AG22) cannot be used, due to unexpected and unexplained trends of K abundances as a function of the effective temperature (see Fig. 2). These trends are all statistically very significant, they are seen at every metallicity, and they present a monotonic increases in K abundances as a function of temperature, gravity, and/or magnitude all the way above the luminosity level of the RGB bump, above which the stars should show a completely homogeneised envelope, no more affected by any kind of mixing. Since no such trend is present in the other abundances by AG22 (Fe, Na, or Mg) we infer some problems in the analysis related to the K, either in measurements or the application of non-local thermodynamic equilibrium (NLTE) corrections.
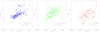 |
Fig. 2. Ratios of [K/Fe] as a function of the effective temperature in stars of ω Cen from the recent analysis by Alvarez Garay et al. (2022: AG22). Stars are separated in metallicity bins [Fe/H] ≤ −1.70 dex, −1.70 < [Fe/H] ≤ −1.30 dex, and [Fe/H] > −1.30 dex, from left to right. The vertical line indicates the approximate temperature level of the RGB bump in ω Cen (G ∼ 14.0 mag) on the temperature scale of AG22. In each panel we report the Pearson linear regression correlation coefficient, the number of stars in the metallicity bin, and the two-tail probability of the linear regression occurring by mere chance. |
Finally, in Fig. 1 (right panel) GCs still to be explored for K abundances and showing moderately high [Ca/Mg] ratios are highlighted: M 15 (red squares), NGC 1904 (black squares) and NGC 6093 (M 80), although these high ratios are restricted to only a few stars in each GC. To these GCs, we also add a large sample of stars with GIRAFFE spectra analysed by Carretta et al. (2010c) in M 54 (NGC 6715: cyan squares).
After ω Cen, M 54 is the second most massive GC currently located in the Milky Way. These two GCs may even follow a similar path of dynamical evolution, albeit at different times (see Carretta et al. 2010d). With a clear, intrinsic metallicity dispersion, M 54 is located in the highest-density region of the Sagittarius dwarf galaxy, presently in its disruption phase in our Galaxy (Ibata et al. 1994). For the purposes of the present work, the distribution in Fig. 1 shows that M 54 is the ideal target where to look in order to study the multiple population phenomenon in the high-temperature regime, by exploiting the largest set of homogeneous abundances of proton-capture elements derived from high-resolution spectroscopy in this GC (Carretta et al. 2010c).
3. Observations and abundance analysis
GIRAFFE spectra taken with the high-resolution setup HR18 (R = 19 000) were downloaded from the ESO archive. They were taken under the ESO programme 095.D-0539 (P.I. Mucciarelli), the same as those used for the analysis of similar data in NGC 4833 (Carretta 2021). The one-dimensional and wavelength-calibrated spectra cover the spectral range from about 7460 to about 7883 Å, including the resonance doublet of K I at 7698.98 Å and 7664.91 Å.
The original observations were made by two exposures of 2600 s on 19 July and 19 August 2015. We cross-matched the observed stars with the 76 RGB stars analysed in M 54 by Carretta et al. (2010c), finding 43 stars in common. The spectra were sky subtracted. We decided to drop the exposure acquired on 19 August, since the spectra were of lower quality and S/N, to avoid introducing additional noise. From the remaining set, we disregarded one star with a very low S/N spectrum. Our final sample consists in 42 giants in M 54 with atmospheric parameters and abundances of Fe and light-elements O, Na, Mg, Si, Ca, and Sc from Carretta et al. (2010c). Coordinates and magnitudes for the whole sample can be found in Carretta et al. (2010c) in the CDS repository. All the abundances and the atmospheric parameters are reported for convenience in Table 1, together with the S/N of the spectra.
Atmospheric parameters and abundances of selected stars in M 54.
Following the procedure in Carretta (2021), we neglected the line at 7664.91 Å (contaminated by strong telluric line) and we focused on the 7698.98 Å line, which is affected by a weaker line. This spectral region was then cleaned by dividing for a synthetic spectrum of the telluric lines over the region 7681–7710 Å, following the procedure described for the [O I] forbidden line in Carretta et al. (2006).
On these cleaned spectra, we used the package ROSA (Gratton 1988) to measure the equivalent widths (EWs) of the K line. For the analysis we adopted the same atmospheric parameters derived by Carretta et al. (2010c). As widely discussed (see Carretta et al. 2014; Carretta 2021; Mucciarelli et al. 2015), when using vt values derived by moderately weak Fe lines together with strong lines as those of Ba II or K I, a trend of abundance as a function of vt may occur. A classical way to bypass the problem is to calibrate vt as a function of a parameter such as the surface gravity, adopting a constant metallicity for all the cluster stars. However, this is not the best procedure for a GC showing an intrinsic metallicity spread (about 0.19 dex) such as M 54. The resulting abundances then show an unavoidable trend, decreasing as vt increases. This effect does not changes the results, owing to the small internal error estimated for vt (Carretta et al. 2010c) with respect to the large spread we found in K (see below).
For strict homogeneity with previous works (Carretta et al. 2013a; Mucciarelli et al. 2015, 2017; Carretta 2021), we corrected K abundances for departure from LTE using a multivariate interpolation as a function of temperature, gravity, metallicity, and equivalent width of the K I line from the set of models by Takeda et al. (2002) 1. Reggiani et al. (2019) produced a much more extensive grid of NLTE corrections, based on more updated atom model and collisions with hydrogen and electrons. We downloaded their grid (updated 16 April 2021) from CDS and computed the corrections with the same interpolatory function as above. We found that an almost rigid shift by 0.186 dex (rms = 0.040 dex, 42 stars) in [K/Fe] results from differences in the corrected abundances, with the final [K/Fe] ratios being higher when using the grid by Reggiani and collaborators. While absolute values differ, ranking is well preserved and we keep to the previous corrections for homogeneity.
We derived sensitivities of K abundances to changes in the atmospheric parameters. Coupled to the sensitivities in Fe and to the internal uncertainties in each parameters as estimated in Carretta et al. (2010c), we obtained star to star errors. These were summed in quadrature to uncertainties in the EW measurements, estimated by Cayrel (1988) formula. In the ranges S/N > 100, 60 < S/N < 100, and S/N < 60, the total internal error budget amounts to 0.081 dex, 0.089 dex, and 0.103 dex, respectively. We then adopted the average 0.091 dex as the typical internal error associated with the [K/Fe] ratios in M 54.
The derived [K/Fe] ratios, corrected for non-LTE effects, are listed in the second to last column of Table 1. We adopted the solar abundance of K from Anders & Grevesse (1989).
4. Results
In M 54 we observe a large spread of K abundances. The rms about a mean value [K/Fe] = 0.015 dex is 0.202 dex (42 stars), the interquartile range is IQR[K/Fe] = 0.295, and the [K/Fe] values in this GC extends over almost 1 dex, with no trend as a function of effective temperature. Results for K are summarised in Fig. 3, where the [K/Fe] ratios are compared to other elements involved in the proton-capture reactions occurring in various temperature regimes: O, Na, Mg, Si, Ca, and Sc (Carretta et al. 2010c).
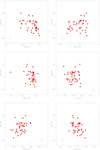 |
Fig. 3. Abundance ratios of [K/Fe] in M 54 as a function of abundances of O, Na, Mg, Si, Ca, and Sc. Internal, star to star errors from the present study and from Carretta et al. (2010c) are shown in each panel. |
The panels on the left side of this figure show the most significant relations. Potassium abundances are anti-correlated with elements that are depleted in multiple stellar populations, such as O and Mg. The anti-correlation [K/Fe]–[O/Fe] is highly significant, the Pearson correlation coefficient being r = −0.471 with 42 pairs. A Student’s test for the null hypothesis that the true correlation is zero returns a probability p = 1.6 × 10⁻³. This means that the large spread in K observed in M 54 is likely due to the same network of proton-capture reactions acting at early times to self-enrich the intra-cluster medium with product of hot H-burning, for instance matter severely depleted in O.
Although there is no doubt that the highest K abundances are detected in stars with the lowest Mg values (central left panel in Fig. 3), statistically the anti-correlation between K and Mg abundances is only marginally significant. Formally we obtained p = 0.055, slightly exceeding the typical threshold value of 0.05. The explanation is twofold. First, a straight line may be not the best functional form to approximate the K–Mg relation. Second, although we observe a spread in K abundances of about 0.9 dex, in M 54 there is an intrinsic paucity of very Mg-poor stars, those with which the highest [K/Fe] values should be associated. In our sample of 42 stars, only one has [Mg/Fe] < 0 (2.4%). There is not a selection bias affecting our present sample: among the 76 giants examined by Carretta et al. (2010c) we only found two stars with [Mg/Fe] below zero (2.6%).
The lack of stars with severe depletion in Mg seems to be an actual feature of M 54, at odds with what was found in NGC 2808 (Carretta 2015) and NGC 4833 (Carretta et al. 2014), despite M 54 being a more massive GC. We also note that the anti-correlation K–Mg is found regardless of the metallicity, being traced in both the metal-rich and metal-poor components individuated in M 54 (Carretta et al. 2010c).
Other relations, in particular with elements expected to be enhanced by proton-capture reactions, appear to be less significant (see right side panels in Fig. 3). A correlation with Na appears not to be significant, although expected, owing to the neat anti-correlation K–O and the quite extended Na-O anti-correlation found in M 54 (Carretta et al. 2010c). There seems to be no relation between K and Si. We recall that in M 54, a clear Si–Al correlation and Mg–Al anti-correlation were found, although evidence of a Mg–Si anti-correlation is weak (Carretta et al. 2010c). We note that Al abundances were derived in Carretta et al. (2010c) only for six stars with UVES spectra and only one star (38003167) is included in the present sample with derived K abundances. This occurrence prevents us from drawing any further conclusion on the Mg–Al cycle, in particular on the peculiar interplay found by Masseron et al. (2019) in very metal-poor GCs such as M 15 and M 92, where the most Mg-depleted stars are not always accompanied by the most enhanced Al abundances. Clearly, more Al data would be welcome for M 54.
Finally, it is interesting to note that a significant K–Ca correlation (bottom left panel in Fig. 3) does exist in M 54 (p = 1.4 × 10⁻²), whereas an anti-correlation with Sc is apparent. However, in the extensive census of 77 GCs, Carretta & Bragaglia (2021) found excesses for both Ca and Sc in M 54 with respect to an unpolluted sample of field stars that show only the effects of nucleosynthesis by supernovae.
The dearth of Mg-poor stars in M 54 is clearly seen by comparing our results with those in NGC 2808 (Fig. 4). While the entire spread in K is about half of the one obtained in M 54, NGC 2808 hosts a sizeable population of Mg-poor stars. As a consequence, the K–Mg relation is steeper in M 54, accounting for the marginally significant statistics, as seen above.
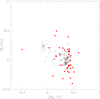 |
Fig. 4. Comparison of the K–Mg anti-correlation in M 54 (present work, filled red points) to the one in NGC 2808 (Carretta 2015; Mucciarelli et al. 2015, open circles). |
Unfortunately a similar comparison with optical data for ω Cen is hampered by the unexplained trend in temperatures of K abundances derived by AG22. The comparison with the 21 stars in Mészáros et al. (2020) passing their quality cuts is shown in Fig. 5. With this sample from APOGEE data, the comparison is similar to the one for NGC 2808: a larger spread in K abundances for M 54 accompanied by the presence of Mg poor stars in ω Cen. The offset in [K/Fe] is probably due to the NLTE corrections: Mészáros et al. (2020) do not mention any, whereas the corrections made with the grid of Takeda et al. (2002) lead to NLTE K abundances that are lower by about −0.5 dex. Mészáros et al. claim a weak K–Mg anti-correlation in ω Cen, but we found that despite the limited size of their sample, the anti-correlation is significant (p = 1.1 × 10⁻³)2. Hence, the existence of a K–Mg anti-correlation also in ω Cen seems to be well assessed, despite possible problems in the analysis (AG22) or the weakness of K lines at low metallicity in infrared data (Mészáros et al. 2020).
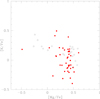 |
Fig. 5. Same as for Fig. 4, but for ω Cen using infrared APOGEE data from Mészáros et al. (2020, empty circles). |
5. Summary
We presented the first study of K abundances in NGC 6715 (M 54), the second most massive GC in the Milky Way and a former member of the Sagittarius dwarf galaxy. We analysed FLAMES-GIRAFFE archival spectra with the high-resolution setup HR18 of 42 RGB stars in this GC.
The [K/Fe] ratios, obtained from the K I 7698.98 Å line and corrected for NLTE effects with the grid by Takeda et al. (2002) span a range of about a full dex. The [K/Fe] and [O/Fe] ratios in M 54 are found to be anti-correlated to a high level of significance, indicating that the large excess in K is likely due to the same self-enrichment process that generates the multiple population phenomenon in GCs. A marginally significant K–Mg anti-correlation is also observed. On the other hand, the expected correlations with species that are expected to be enhanced in proton-capture reactions is less clear, apart from a significant K–Ca correlation, confirming the Ca excesses with respect to unpolluted field stars recently detected by Carretta & Bragaglia (2021) in this GC. The comparison with NGC 2808 shows that the observed pattern is well explained by the large spread of K in M 54 accompanied by a lack of very Mg-poor stars, which are instead hosted in the first GC as well as in ω Cen.
Our data confirm the predictions by Carretta et al. (2014) based on the diagnostic plot [Ca/Mg] versus [Ca/H], independently using K abundances as tracers of the action of hot H-burning at very high-temperature regime. This regime is predicted (see Ventura et al. 2012; Prantzos et al. 2017) to be more efficient in massive GCs populating the low-metallicity tail of the [Fe/H] distribution of GCs. Carretta (2021) showed that the few GCs where significant variations in K abundances are detected so far (NGC 2419, NGC 2808, NGC 5139 and NGC 4833) tend to populate the high-mass (represented by the cluster total absolute magnitude) and low-metallicity region of the MV–[Fe/H] plane. To these GCs, we now also add M 54. In the same region are also located most of the GCs where excesses in Ca and or Sc were detected with respect to unpolluted field stars by Carretta & Bragaglia (2021). All these observations concur to outline a picture where particular conditions may allow the proton-capture reactions to bypass, in part, the usual production of Al, reaching up to heavier species such as K, and also possibly Ca and Sc.
Since the interplay between polluters acting at different temperature (mass) regimes may offer precious constraints to the theoretical models, it is important to gather as much observational material as possible of different species involved in proton-capture reactions. In this sense, the present study represents another step towards the nature of the still elusive FG polluters.
The primary dependence of multiple populations on the total mass of GCs has been well known since the first studies of the Na–O and Mg–Al anti-correlations with respect to global cluster parameters (Carretta 2006, his Fig. 12). It is thus easy to predict large variations in light elements in the two most massive GCs in the Galaxy, even for species requiring high temperatures for nuclear burning. For M 54, data are presented in the present work. Concerning ω Cen, we note that Mészáros et al. (2020) already provided convincing evidence of large K variations, using only stars more metal-rich than [Fe/H] = −1.5 dex. Unfortunately, the K lines in the H band become very weak at low metallicities, a regime where the production of K from proton-capture reactions is predicted to be more efficient. The analysis of optical spectra looks to be more promising, once spurious trends of K as a function of the effective temperature of stars are able to be corrected.
We note that above their Fig. 10, Mészáros et al. (2020) wrote [Fe/H] < −1.5 among their quality cuts. Their figure for ω Cen is, however, reproduced only if [Fe/H] > −1.5 is used.
Acknowledgments
This paper is based on data obtained from the ESO Science Archive Facility under request number 593222. I wish to thank Yazan Al Momany for providing the original WFI photometry for M 54 and Angela Bragaglia for valuable help and useful discussions. This research has made large use of the SIMBAD database (in particular Vizier), operated at CDS, Strasbourg, France, and of the NASA’s Astrophysical Data System.
References
- Alvarez Garay, D. A., Mucciarelli, A., Lardo, C., Bellazzini, M., & Merle, T. 2022, ApJ, 928, L11 [NASA ADS] [CrossRef] [Google Scholar]
- Anders, E., & Grevesse, N. 1989, Geochim. Cosmochim. Acta, 53, 197 [Google Scholar]
- Arnould, M., Goriely, S., & Jorissen, A. 1999, A&A, 347, 572 [NASA ADS] [Google Scholar]
- Bastian, N., & Lardo, C. 2018, ARA&A, 56, 83 [Google Scholar]
- Carretta, E. 2006, AJ, 131, 1766 [Google Scholar]
- Carretta, E. 2015, ApJ, 810, 148 [Google Scholar]
- Carretta, E. 2021, A&A, 649, A154 [NASA ADS] [CrossRef] [EDP Sciences] [Google Scholar]
- Carretta, E., & Bragaglia, A. 2019, A&A, 627, L7 [NASA ADS] [CrossRef] [EDP Sciences] [Google Scholar]
- Carretta, E., & Bragaglia, A. 2021, A&A, 646, A9 [EDP Sciences] [Google Scholar]
- Carretta, E., Bragaglia, A., Gratton, R. G., et al. 2006, A&A, 450, 523 [NASA ADS] [CrossRef] [EDP Sciences] [Google Scholar]
- Carretta, E., Bragaglia, A., Gratton, R. G., et al. 2009a, A&A, 505, 117 [NASA ADS] [CrossRef] [EDP Sciences] [Google Scholar]
- Carretta, E., Bragaglia, A., Gratton, R. G., & Lucatello, S. 2009b, A&A, 505, 139 [NASA ADS] [CrossRef] [EDP Sciences] [Google Scholar]
- Carretta, E., Bragaglia, A., Gratton, R. G., et al. 2010a, A&A, 516, A55 [NASA ADS] [CrossRef] [EDP Sciences] [Google Scholar]
- Carretta, E., Bragaglia, A., Gratton, R. G., et al. 2010b, ApJ, 712, L21 [NASA ADS] [CrossRef] [Google Scholar]
- Carretta, E., Bragaglia, A., Gratton, R. G., et al. 2010c, A&A, 520, A95 [NASA ADS] [CrossRef] [EDP Sciences] [Google Scholar]
- Carretta, E., Bragaglia, A., Gratton, R. G., et al. 2010d, ApJ, 714, L7 [Google Scholar]
- Carretta, E., Lucatello, S., Gratton, R. G., Bragaglia, A., & D’Orazi, V. 2011, A&A, 533, A69 [NASA ADS] [CrossRef] [EDP Sciences] [Google Scholar]
- Carretta, E., Gratton, R. G., Bragaglia, A., et al. 2013a, ApJ, 769, 40 [Google Scholar]
- Carretta, E., Bragaglia, A., Gratton, R. G., et al. 2013b, A&A, 557, A138 [NASA ADS] [CrossRef] [EDP Sciences] [Google Scholar]
- Carretta, E., Bragaglia, A., Gratton, R. G., et al. 2014, A&A, 564, A60 [NASA ADS] [CrossRef] [EDP Sciences] [Google Scholar]
- Carretta, E., Bragaglia, A., Gratton, R. G., et al. 2015, A&A, 578, A116 [CrossRef] [EDP Sciences] [Google Scholar]
- Cayrel, R. 1988, IAUS, 132, 345 [NASA ADS] [Google Scholar]
- Cohen, J. G., & Kirby, E. N. 2012, ApJ, 760, 86 [Google Scholar]
- Denisenkov, P. A., & Denisenkova, S. N. 1989, Sov. Astron. Lett., 1538, 11 [Google Scholar]
- Gratton, R. G. 1988, Rome Obs. Preprint Ser., 29 [Google Scholar]
- Gratton, R. G., Bonifacio, P., Bragaglia, A., et al. 2001, A&A, 369, 87 [NASA ADS] [CrossRef] [EDP Sciences] [Google Scholar]
- Gratton, R. G., Sneden, C., & Carretta, E. 2004, ARA&A, 42, 385 [Google Scholar]
- Gratton, R. G., Bragaglia, A., Carretta, E., et al. 2019, A&ARv, 27, 8 [Google Scholar]
- Ibata, R. A., Irwin, M. J., & Gilmore, G. 1994, Nature, 370, 194 [NASA ADS] [CrossRef] [Google Scholar]
- Iliadis, C., Karakas, A. I., Prantzos, N., Lattanzio, J. C., & Doherty, C. L. 2016, ApJ, 818, 98 [Google Scholar]
- Lardo, C., Bellazzini, M., Pancino, E., et al. 2011, A&A, 525, A114 [NASA ADS] [CrossRef] [EDP Sciences] [Google Scholar]
- Masseron, T., García-Hernández, D. A., Mészáros, S., et al. 2019, A&A, 622, A191 [NASA ADS] [CrossRef] [EDP Sciences] [Google Scholar]
- Mészáros, S., Masseron, T., García-Hernández, D. A., et al. 2020, MNRAS, 492, 1641 [Google Scholar]
- Monelli, M., Milone, A. P., Stetson, P. B., et al. 2013, MNRAS, 431, 2126 [NASA ADS] [CrossRef] [Google Scholar]
- Mucciarelli, A., Bellazzini, M., Ibata, R., et al. 2012, MNRAS, 426, 2889 [Google Scholar]
- Mucciarelli, A., Bellazzini, M., Merle, T., et al. 2015, ApJ, 801, 68 [Google Scholar]
- Mucciarelli, A., Merle, T., & Bellazzini, M. 2017, A&A, 600, A104 [NASA ADS] [CrossRef] [EDP Sciences] [Google Scholar]
- Nardiello, D., Libralato, M., Piotto, G., et al. 2018, MNRAS, 481, 3382 [NASA ADS] [CrossRef] [Google Scholar]
- Norris, J. E., & Da Costa, G. S. 1995, ApJ, 441, L81 [Google Scholar]
- Prantzos, N., Charbonnel, C., & Iliadis, C. 2017, A&A, 608, A28 [NASA ADS] [CrossRef] [EDP Sciences] [Google Scholar]
- Reggiani, H., Amarsi, A. M., Lind, K., et al. 2019, A&A, 627, A177 [EDP Sciences] [Google Scholar]
- Roederer, I. U., & Thompson, I. B. 2015, MNRAS, 449, 3889 [Google Scholar]
- Smith, G. H. 1987, PASP, 99, 67 [Google Scholar]
- Takeda, Y., Okhubo, M., & Sadakane, K. 2002, PASJ, 54, 451 [Google Scholar]
- Ventura, P., D’Antona, F., Di Criscienzo, M., et al. 2012, ApJ, 761, L30 [Google Scholar]
All Tables
All Figures
|
Fig. 1. Abundance ratios of [Ca/Mg] as a function of [Ca/H] in several GCs. In all three panels the empty squares indicate stars with UVES spectra in our FLAMES survey from Carretta et al. (2010b, 2009b, 2010c, 2011, 2013b, 2014, 2015). In each panel a few GCs are highlighted. Left panel: NGC 4833 (Carretta et al. 2014, red squares), NGC 6809 (Carretta et al. 2010b, 2009b: blue squares), NGC 2808 (Carretta 2015: black squares), and NGC 5139 (ω Cen, Norris and Da Costa 1995: orange triangles). Middle panel: NGC 2419 (Cohen & Kirby 2012; Mucciarelli et al. 2012: blue circles) and ω Cen from APOGEE infrared data (Mészáros et al. 2020, green triangles). Right panel: NGC 7078 (M 15: Carretta et al. 2010b, 2009b: red squares), NGC 1904 (Carretta et al. 2010b, 2009b: black squares), NGC 6093 (M 80: Carretta et al. 2015: magenta squares), and NGC 6715 (M 54: Carretta et al. 2010c: cyan squares). The different vertical scale in all panels should be noted. |
| In the text | |
|
Fig. 2. Ratios of [K/Fe] as a function of the effective temperature in stars of ω Cen from the recent analysis by Alvarez Garay et al. (2022: AG22). Stars are separated in metallicity bins [Fe/H] ≤ −1.70 dex, −1.70 < [Fe/H] ≤ −1.30 dex, and [Fe/H] > −1.30 dex, from left to right. The vertical line indicates the approximate temperature level of the RGB bump in ω Cen (G ∼ 14.0 mag) on the temperature scale of AG22. In each panel we report the Pearson linear regression correlation coefficient, the number of stars in the metallicity bin, and the two-tail probability of the linear regression occurring by mere chance. |
| In the text | |
|
Fig. 3. Abundance ratios of [K/Fe] in M 54 as a function of abundances of O, Na, Mg, Si, Ca, and Sc. Internal, star to star errors from the present study and from Carretta et al. (2010c) are shown in each panel. |
| In the text | |
|
Fig. 4. Comparison of the K–Mg anti-correlation in M 54 (present work, filled red points) to the one in NGC 2808 (Carretta 2015; Mucciarelli et al. 2015, open circles). |
| In the text | |
|
Fig. 5. Same as for Fig. 4, but for ω Cen using infrared APOGEE data from Mészáros et al. (2020, empty circles). |
| In the text | |
Current usage metrics show cumulative count of Article Views (full-text article views including HTML views, PDF and ePub downloads, according to the available data) and Abstracts Views on Vision4Press platform.
Data correspond to usage on the plateform after 2015. The current usage metrics is available 48-96 hours after online publication and is updated daily on week days.
Initial download of the metrics may take a while.