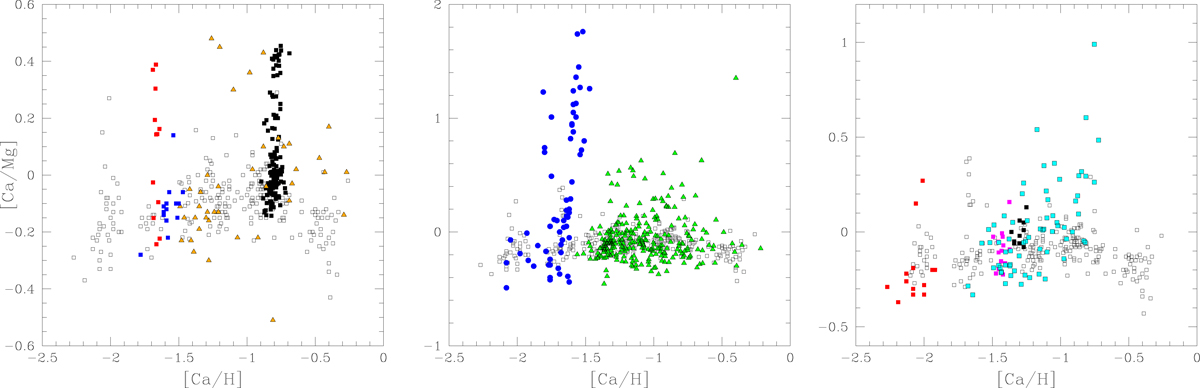
Fig. 1.
Download original image
Abundance ratios of [Ca/Mg] as a function of [Ca/H] in several GCs. In all three panels the empty squares indicate stars with UVES spectra in our FLAMES survey from Carretta et al. (2010b, 2009b, 2010c, 2011, 2013b, 2014, 2015). In each panel a few GCs are highlighted. Left panel: NGC 4833 (Carretta et al. 2014, red squares), NGC 6809 (Carretta et al. 2010b, 2009b: blue squares), NGC 2808 (Carretta 2015: black squares), and NGC 5139 (ω Cen, Norris and Da Costa 1995: orange triangles). Middle panel: NGC 2419 (Cohen & Kirby 2012; Mucciarelli et al. 2012: blue circles) and ω Cen from APOGEE infrared data (Mészáros et al. 2020, green triangles). Right panel: NGC 7078 (M 15: Carretta et al. 2010b, 2009b: red squares), NGC 1904 (Carretta et al. 2010b, 2009b: black squares), NGC 6093 (M 80: Carretta et al. 2015: magenta squares), and NGC 6715 (M 54: Carretta et al. 2010c: cyan squares). The different vertical scale in all panels should be noted.
Current usage metrics show cumulative count of Article Views (full-text article views including HTML views, PDF and ePub downloads, according to the available data) and Abstracts Views on Vision4Press platform.
Data correspond to usage on the plateform after 2015. The current usage metrics is available 48-96 hours after online publication and is updated daily on week days.
Initial download of the metrics may take a while.