Fig. 3
Download original image
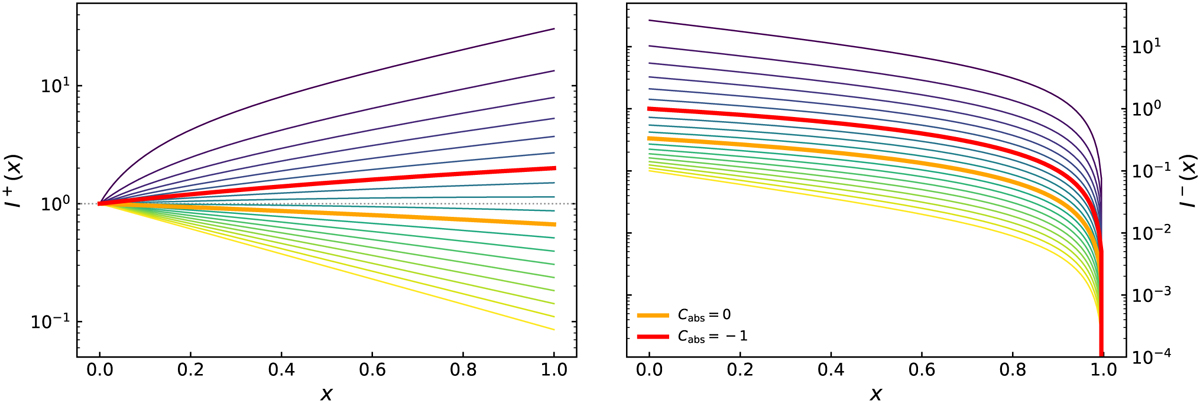
Intensity of the radiation field in the positive (leftpanel) and negative (rightpanel) direction for the 1D radiative transfer model discussed in Sect. 3.3. All models have the same scattering cross section Csca = 1 and the different lines correspond to models with different absorption cross sections Cabs, ranging from 2 to −2.5 in steps of −0.25. The thick orange and red curves correspond to pure scattering and critical net stimulated emission, respectively.
Current usage metrics show cumulative count of Article Views (full-text article views including HTML views, PDF and ePub downloads, according to the available data) and Abstracts Views on Vision4Press platform.
Data correspond to usage on the plateform after 2015. The current usage metrics is available 48-96 hours after online publication and is updated daily on week days.
Initial download of the metrics may take a while.