Fig. 2
Download original image
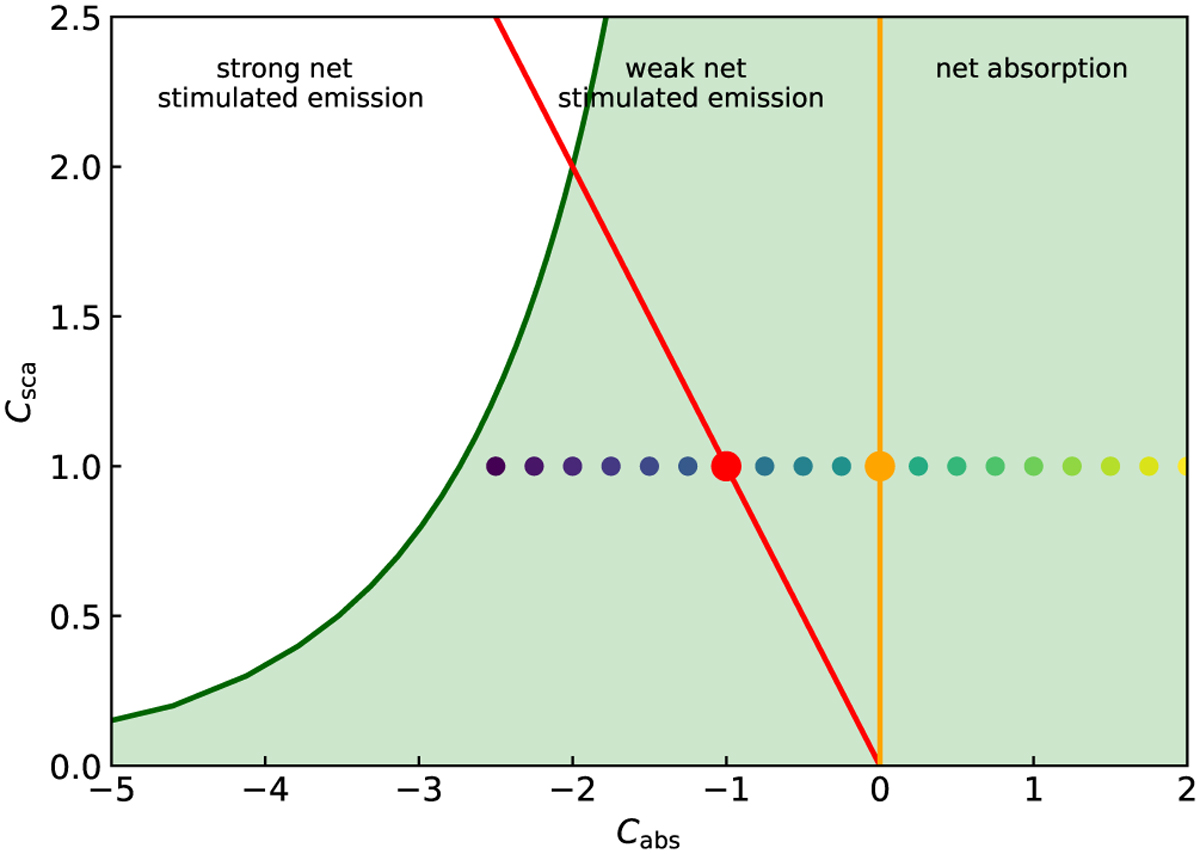
(Cabs, Csca) parameter space for the 1D radiative transfer model discussed in Sect. 3.3. The green shaded area in this plot corresponds to the region with physically viable solutions. The three major regimes (net absorption, weak net stimulated emission, and strong net stimulated emission) are indicated. The orange and red lines indicate the boundaries between these major regimes, and correspond to pure scattering and critical net stimulated emission, respectively. The coloured dots indicate the models shown explicitly in Fig. 3. The white area corresponds to non-physical solutions. The solid green line that indicates the boundary between physical and non-physical solutions is given by the Eqs. (30) and (34).
Current usage metrics show cumulative count of Article Views (full-text article views including HTML views, PDF and ePub downloads, according to the available data) and Abstracts Views on Vision4Press platform.
Data correspond to usage on the plateform after 2015. The current usage metrics is available 48-96 hours after online publication and is updated daily on week days.
Initial download of the metrics may take a while.