Open Access
Fig. 5
Download original image
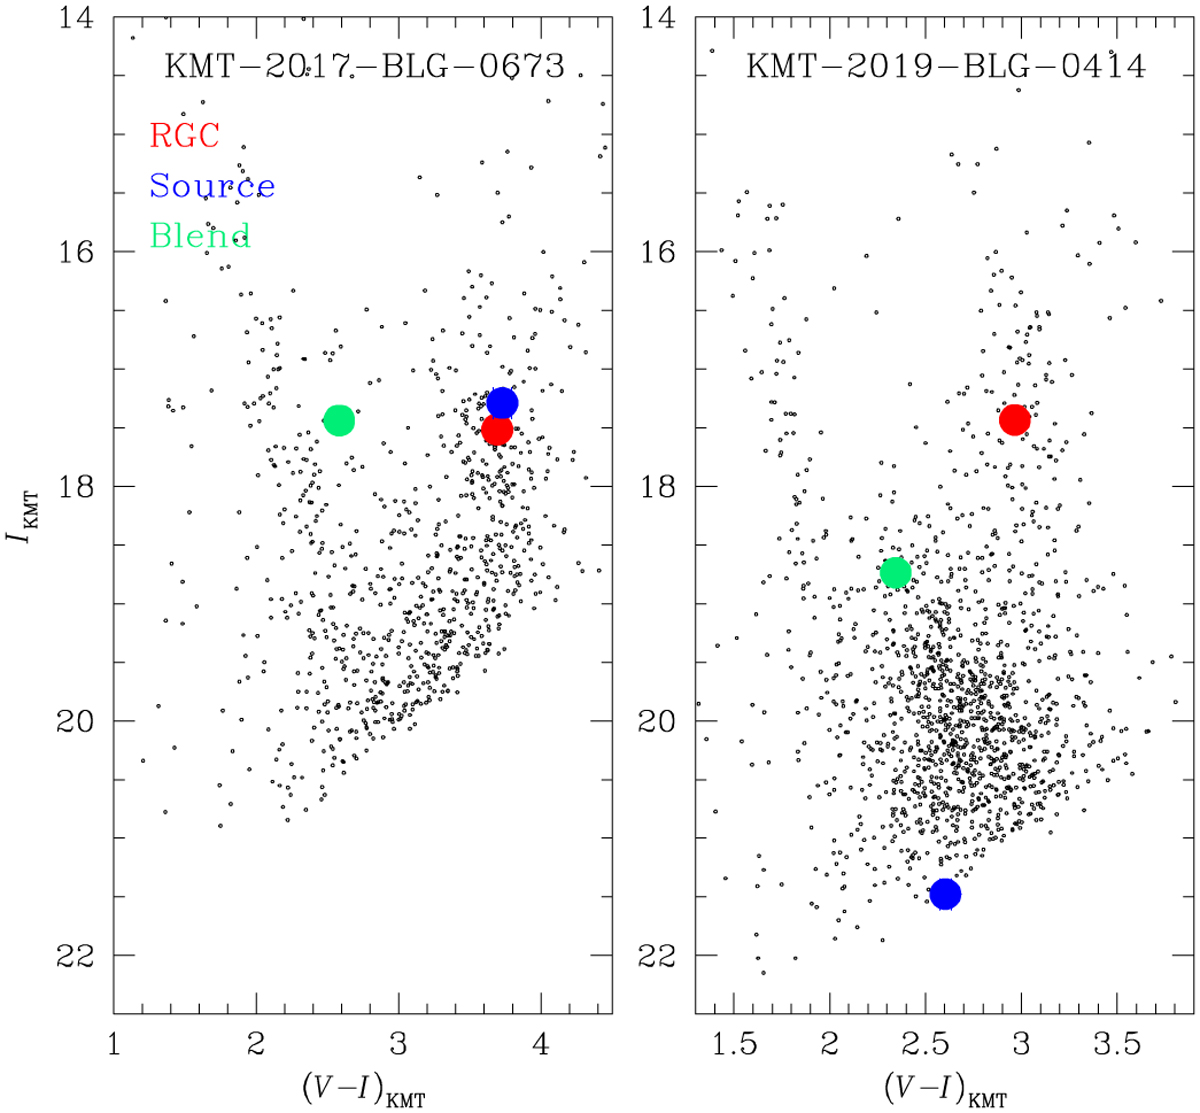
Source locations with respect to the centroids of red giant clump (RGC) in the instrumental color-magnitude diagrams of stars lying in the neighborhood of the source of KMT-2017-BLG-0673 and KMT-2019-BLG-0414 constructed using the pyDIA photometry of KMTC data set. Also marked are the positions of the blend.
Current usage metrics show cumulative count of Article Views (full-text article views including HTML views, PDF and ePub downloads, according to the available data) and Abstracts Views on Vision4Press platform.
Data correspond to usage on the plateform after 2015. The current usage metrics is available 48-96 hours after online publication and is updated daily on week days.
Initial download of the metrics may take a while.