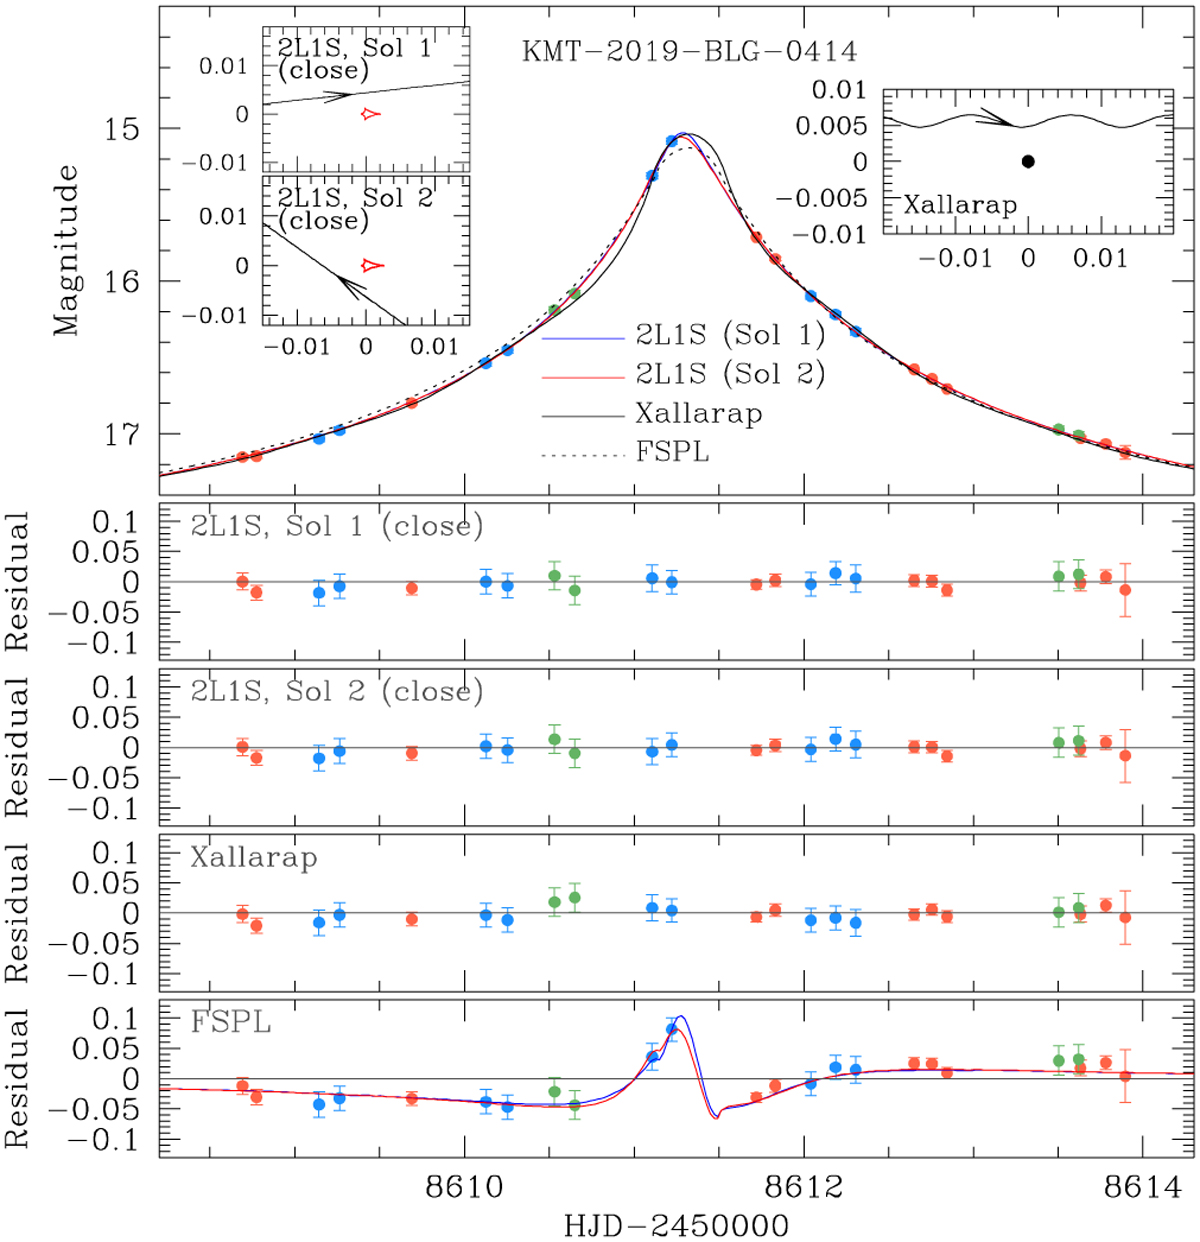
Fig. 4
Download original image
Enlarged view around the anomaly region in the lensing light curve of KMT-2019-BLG-0414. Drawn over the data points are the 1L1S model considering finite-source effects (FSPL), the two 2L1S (solutions 1 and 2) models, and the binary-source model considering xallarap effects (xallarap). The model curves of the two 2L1S models are difficult to be resolved within the line width due to the severe degeneracy between the models. The four bottom panels show the residuals from the individual models. The two left insets in the top panel show the lens-system configurations of the two 2L1S solutions, and the right inset shows the configuration of the xallarap model. The blue and red curves in the bottom panel represent the differences of the 2L1S solutions 1 and 2 from the FSPL model, respectively.
Current usage metrics show cumulative count of Article Views (full-text article views including HTML views, PDF and ePub downloads, according to the available data) and Abstracts Views on Vision4Press platform.
Data correspond to usage on the plateform after 2015. The current usage metrics is available 48-96 hours after online publication and is updated daily on week days.
Initial download of the metrics may take a while.