Fig. 3
Download original image
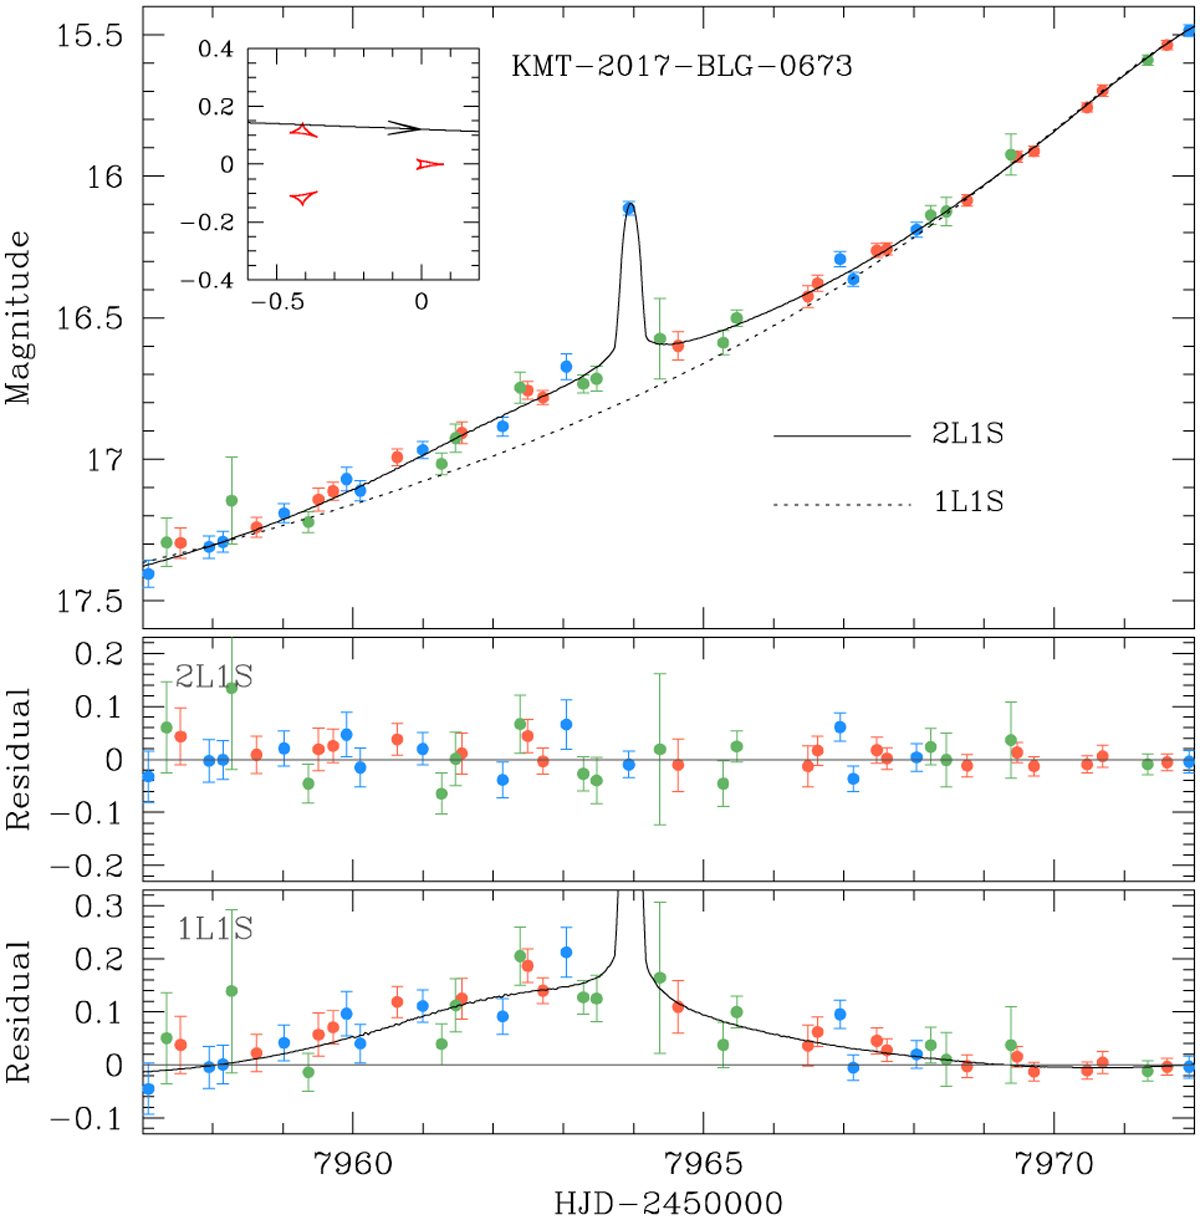
Enlargement of the anomaly region in the lensing light curve of KMT-2017-BLG-0673. The solid and dotted curves drawn over the data points are the 2L1S and 1L1S models, respectively. The residuals from the individual models are shown in the lower two panels. The inset in the top panel shows the lens system configuration, in which the source trajectory (line with an arrow) with respect to the caustic (red figures) is shown. The curve drawn in the bottom panel is the difference between the 2L1S and 1L1S models.
Current usage metrics show cumulative count of Article Views (full-text article views including HTML views, PDF and ePub downloads, according to the available data) and Abstracts Views on Vision4Press platform.
Data correspond to usage on the plateform after 2015. The current usage metrics is available 48-96 hours after online publication and is updated daily on week days.
Initial download of the metrics may take a while.