Fig. 2
Download original image
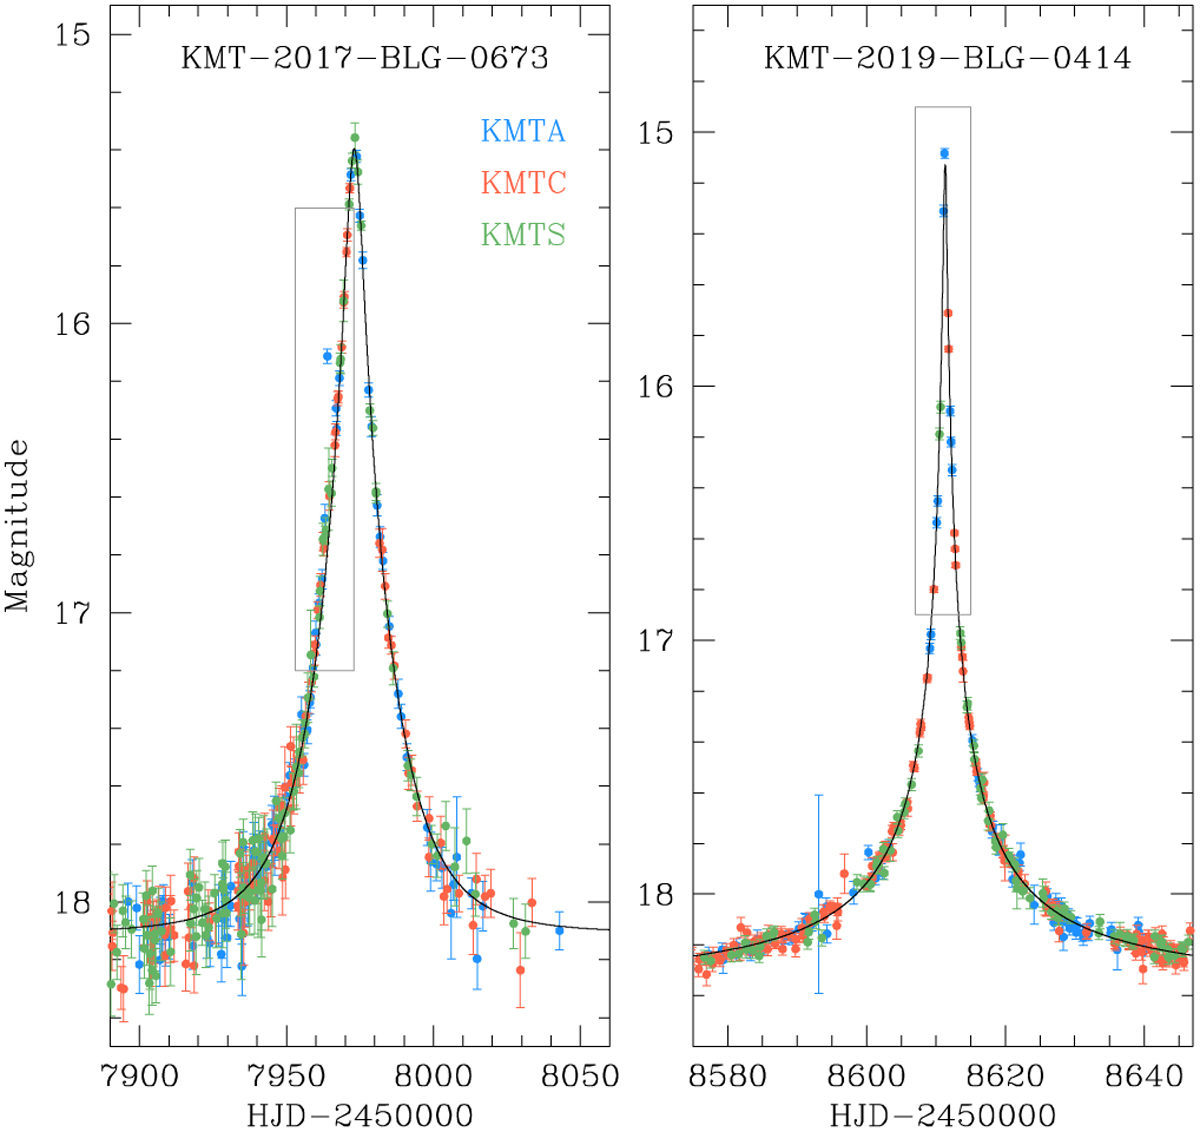
Microlensing light curves of KMT-2017-BLG-0673 and KMT-2019-BLG-0414. The curve drawn over the data points of each light curve is a 1L1S model, and the box indicates the region of the anomaly. The enlarged views of the anomaly regions are shown in Fig. 3 for KMT-2017-BLG-0673 and in Fig. 4 for KMT-2019-BLG-0414. Colors of data points are set to match those of the telescopes marked in the legend.
Current usage metrics show cumulative count of Article Views (full-text article views including HTML views, PDF and ePub downloads, according to the available data) and Abstracts Views on Vision4Press platform.
Data correspond to usage on the plateform after 2015. The current usage metrics is available 48-96 hours after online publication and is updated daily on week days.
Initial download of the metrics may take a while.