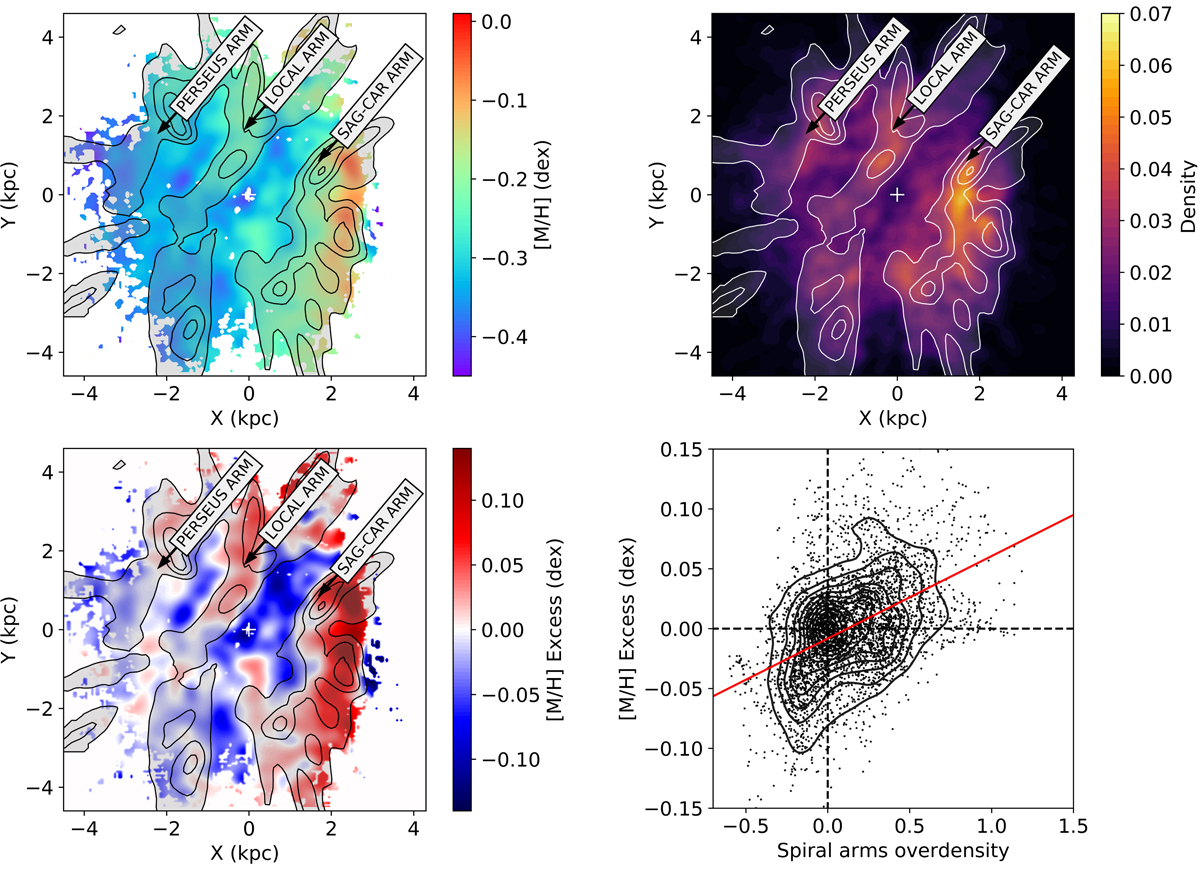
Fig. 2.
Download original image
Correlation between the observed metal-rich features in Sample A and the segments of the nearest spiral arms in the Galaxy. Upper left panel: map of the mean metallicity in the Galactic plane for Sample A shown in Fig. 1, but now compared to the position of the spiral arms from upper main sequence (UMS) stars in Poggio et al. (2021), shown as grey-shaded areas. The labels show the position of the Perseus arm, the Local (Orion) arm, and the Sagittarius-Carina arm based on the UMS map. Upper right panel: bivariate kernel density estimation for Sample A using an Epanechnikov kernel with a smoothing length of 250 pc. The contours are the same as the upper left panel. Lower left panel: same as the upper panels, but now showing the metallicity excess. Regions with a positive (negative) metallicity excess are more metal-rich (-poor) than the average (see text for a detailed explanation). Lower right panel: using the map shown in the lower left panel, the overdensity of the spiral arms versus the metallicity excess is shown for each pixel (black dots). When the spiral arm overdensity is > 0, the region can be considered to belong to a spiral arm, whereas regions with < 0 can be considered as inter-arm regions. Black contours show the distribution of the pixels in the spiral arms’ overdensity versus metallicity excess space. The red line shows a linear fit to the points.
Current usage metrics show cumulative count of Article Views (full-text article views including HTML views, PDF and ePub downloads, according to the available data) and Abstracts Views on Vision4Press platform.
Data correspond to usage on the plateform after 2015. The current usage metrics is available 48-96 hours after online publication and is updated daily on week days.
Initial download of the metrics may take a while.