Fig. 1.
Download original image
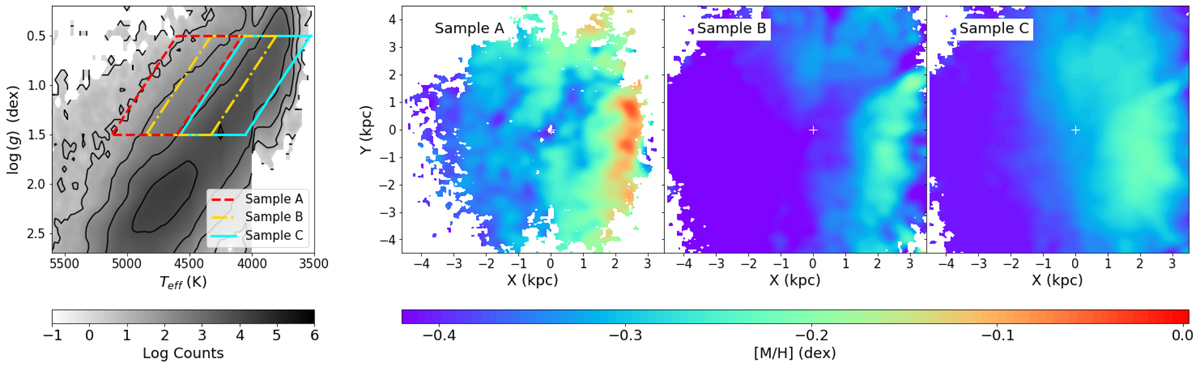
Chemical inhomogeneities in the Galactic disc for three different samples. Left panel: selection of Samples A, B, and C in the Kiel diagram. Right panels: mean metallicity in heliocentric coordinates for Samples A, B, and C (from left to right, respectively) in the Galactic plane. The position of the Sun is shown by the white cross in (X, Y) = (0 kpc, 0 kpc); the Galactic centre is to the right; and Galactic rotation is going clockwise.
Current usage metrics show cumulative count of Article Views (full-text article views including HTML views, PDF and ePub downloads, according to the available data) and Abstracts Views on Vision4Press platform.
Data correspond to usage on the plateform after 2015. The current usage metrics is available 48-96 hours after online publication and is updated daily on week days.
Initial download of the metrics may take a while.