Open Access
Fig. 9
Download original image
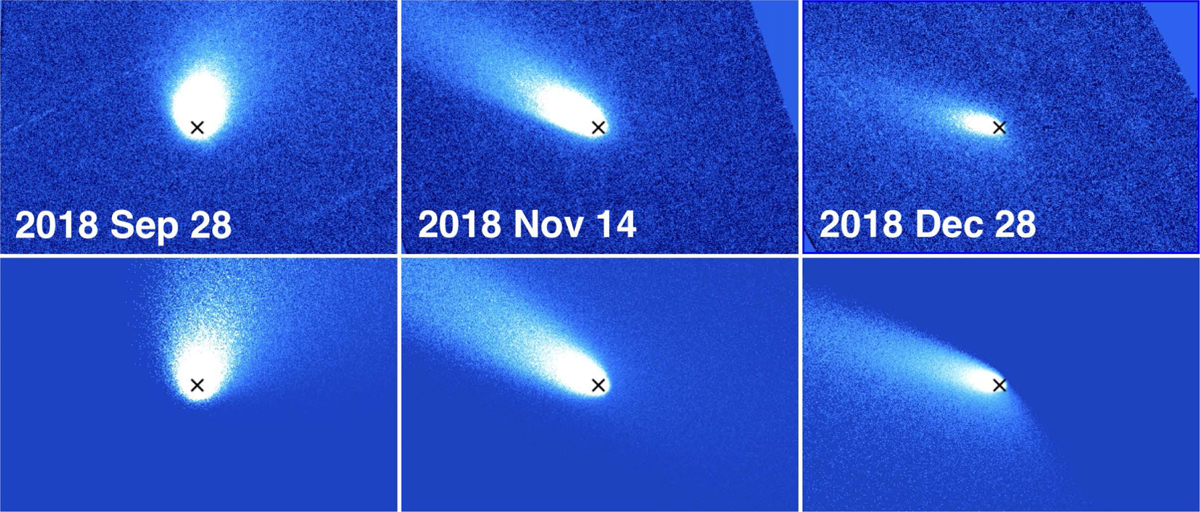
Comparison between HST images (top) and Monte Carlo models (bottom) at three epochs of observation. Adopted model parameters are described in the text. Each panel shows a region 30″ × 25″. The nucleus location is marked with a black cross in each panel. Celestial north points up and east points to the left.
Current usage metrics show cumulative count of Article Views (full-text article views including HTML views, PDF and ePub downloads, according to the available data) and Abstracts Views on Vision4Press platform.
Data correspond to usage on the plateform after 2015. The current usage metrics is available 48-96 hours after online publication and is updated daily on week days.
Initial download of the metrics may take a while.