Open Access
Fig. 6
Download original image
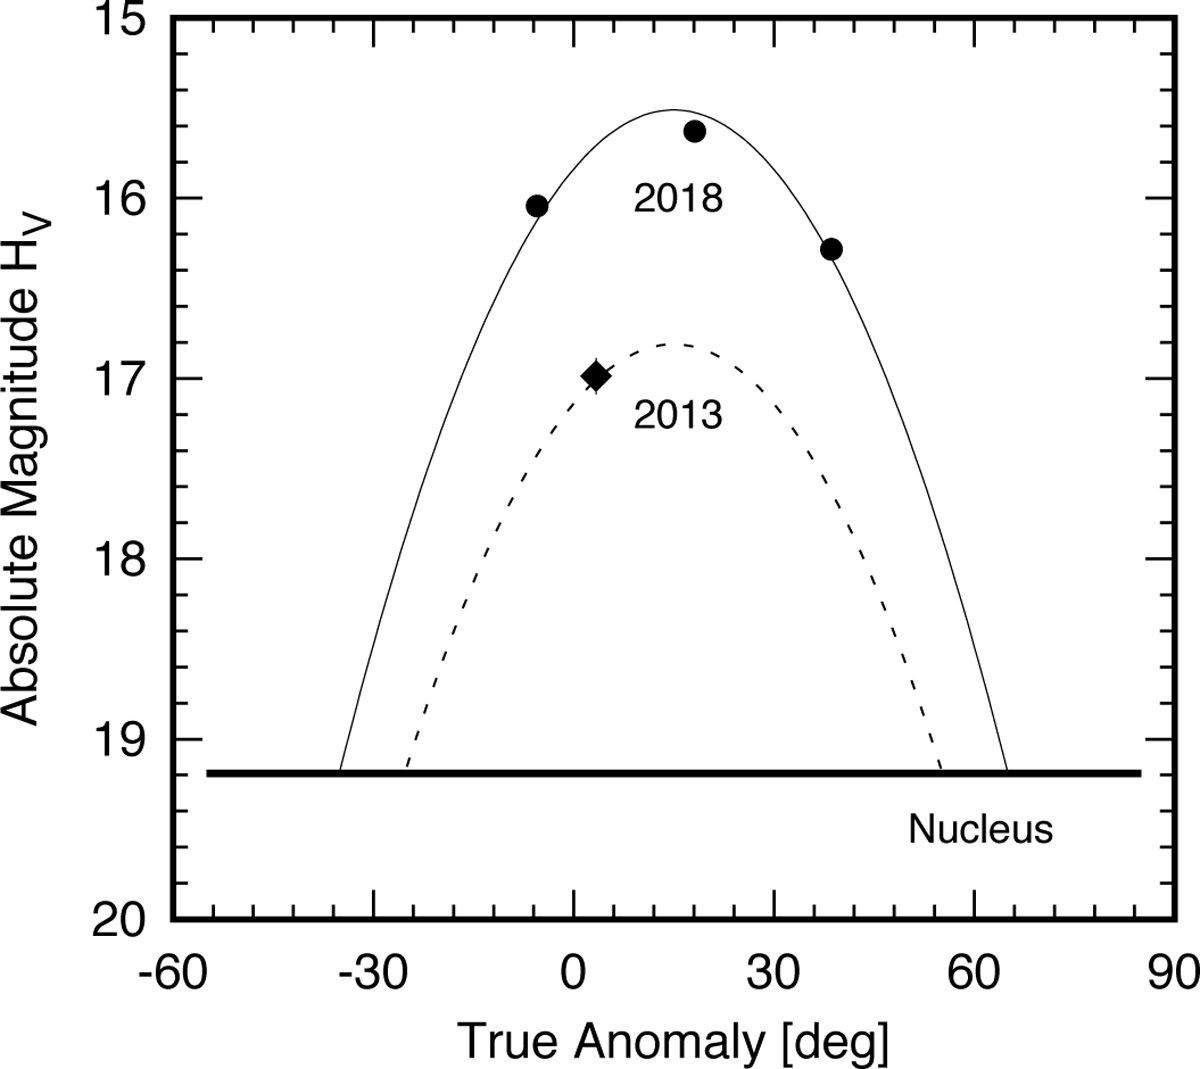
Absolute magnitudes as a function of the true anomaly, showing the difference in activity between the 2013 and 2018 perihelion passages. Solid and dashed lines mark the best-fit quadratic functions and are added to guide the eye.
Current usage metrics show cumulative count of Article Views (full-text article views including HTML views, PDF and ePub downloads, according to the available data) and Abstracts Views on Vision4Press platform.
Data correspond to usage on the plateform after 2015. The current usage metrics is available 48-96 hours after online publication and is updated daily on week days.
Initial download of the metrics may take a while.