Fig. 8.
Download original image
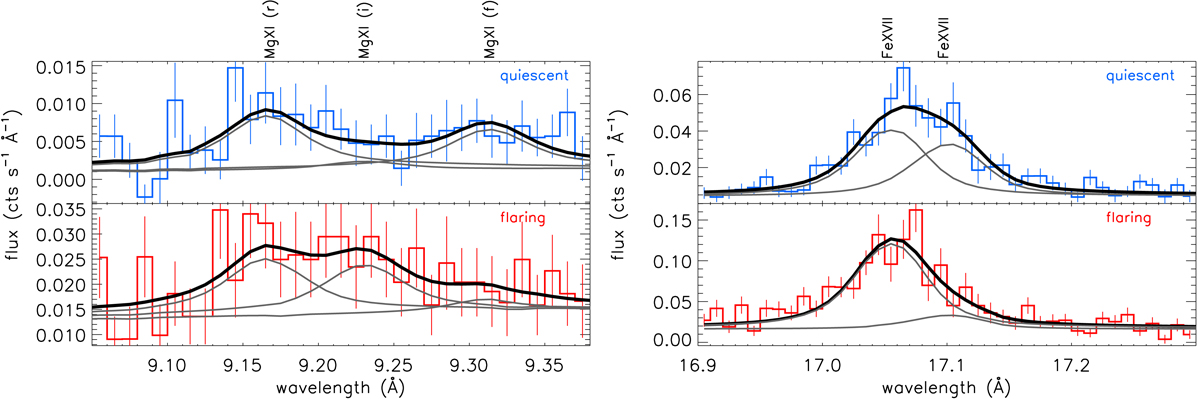
Observed (histogram with error bars) and best fit (solid black curve) spectra of the quiescent and flaring phases in the regions of the Mg XI triplet and Fe XVII density sensitive lines. Best-fit functions corresponding to individual line are also shown with solid grey lines. Left panels show r, f, and i labels, indicating the resonance, inter-combination, and forbidden lines of the Mg XI triplet.
Current usage metrics show cumulative count of Article Views (full-text article views including HTML views, PDF and ePub downloads, according to the available data) and Abstracts Views on Vision4Press platform.
Data correspond to usage on the plateform after 2015. The current usage metrics is available 48-96 hours after online publication and is updated daily on week days.
Initial download of the metrics may take a while.