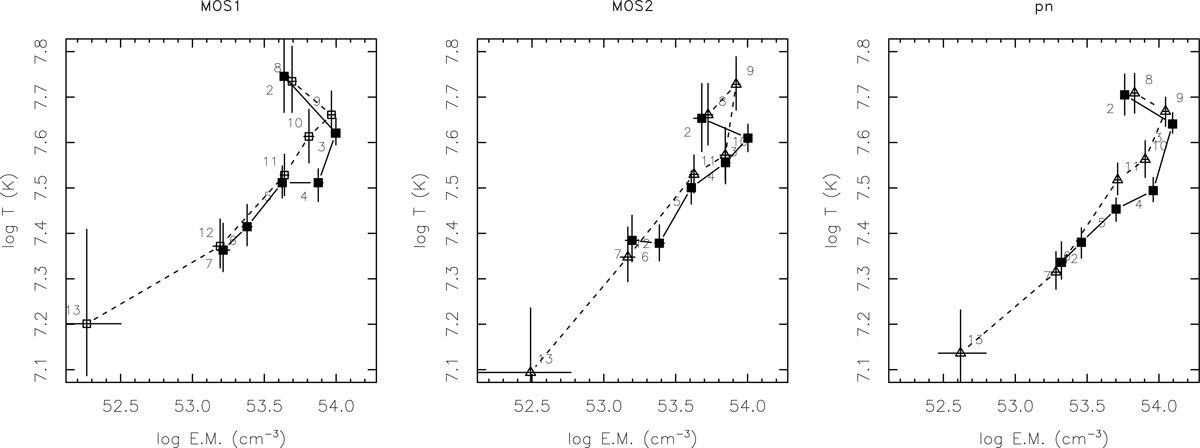
Fig. 4.
Download original image
Log T (MK) vs. E.M. during the evolution of the two flares. Left panel: log T and E.M. derived from MOS1 spectra. Central panel: values derived from the MOS2 spectra. Right panel: parameters derived from pn spectra. Solid symbols refer to the first flare, open symbols refer to the second flare, and numbers refer to the time intervals. The error bars mark the 90% confidence interval.
Current usage metrics show cumulative count of Article Views (full-text article views including HTML views, PDF and ePub downloads, according to the available data) and Abstracts Views on Vision4Press platform.
Data correspond to usage on the plateform after 2015. The current usage metrics is available 48-96 hours after online publication and is updated daily on week days.
Initial download of the metrics may take a while.