Open Access
Fig. 3.
Download original image
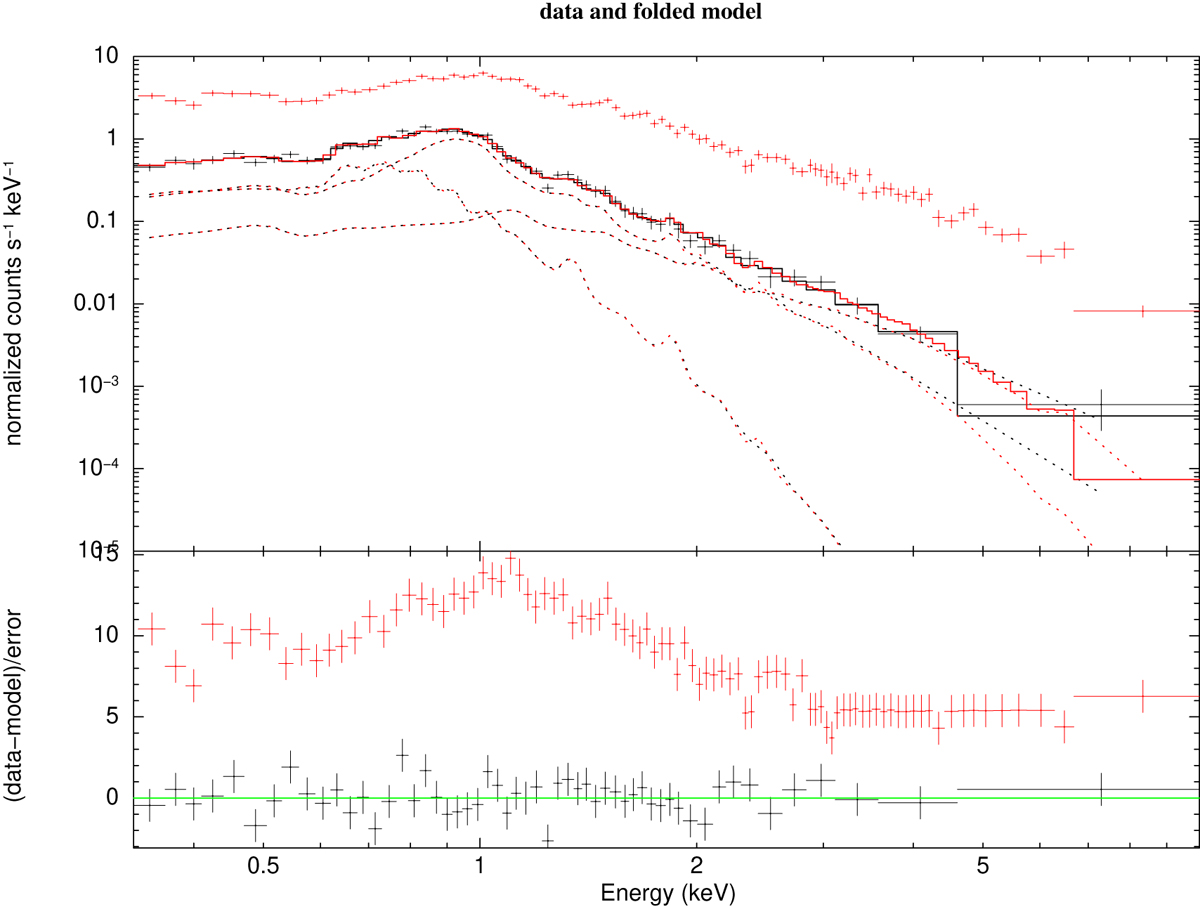
Spectra of MOS 1 relative to the time intervals 1 (black line and crosses) and 3 (red crosses). The best fit model to the spectrum of the plasma during interval 1 with its 3 component is shown along with the χ residuals in the bottom panel.
Current usage metrics show cumulative count of Article Views (full-text article views including HTML views, PDF and ePub downloads, according to the available data) and Abstracts Views on Vision4Press platform.
Data correspond to usage on the plateform after 2015. The current usage metrics is available 48-96 hours after online publication and is updated daily on week days.
Initial download of the metrics may take a while.