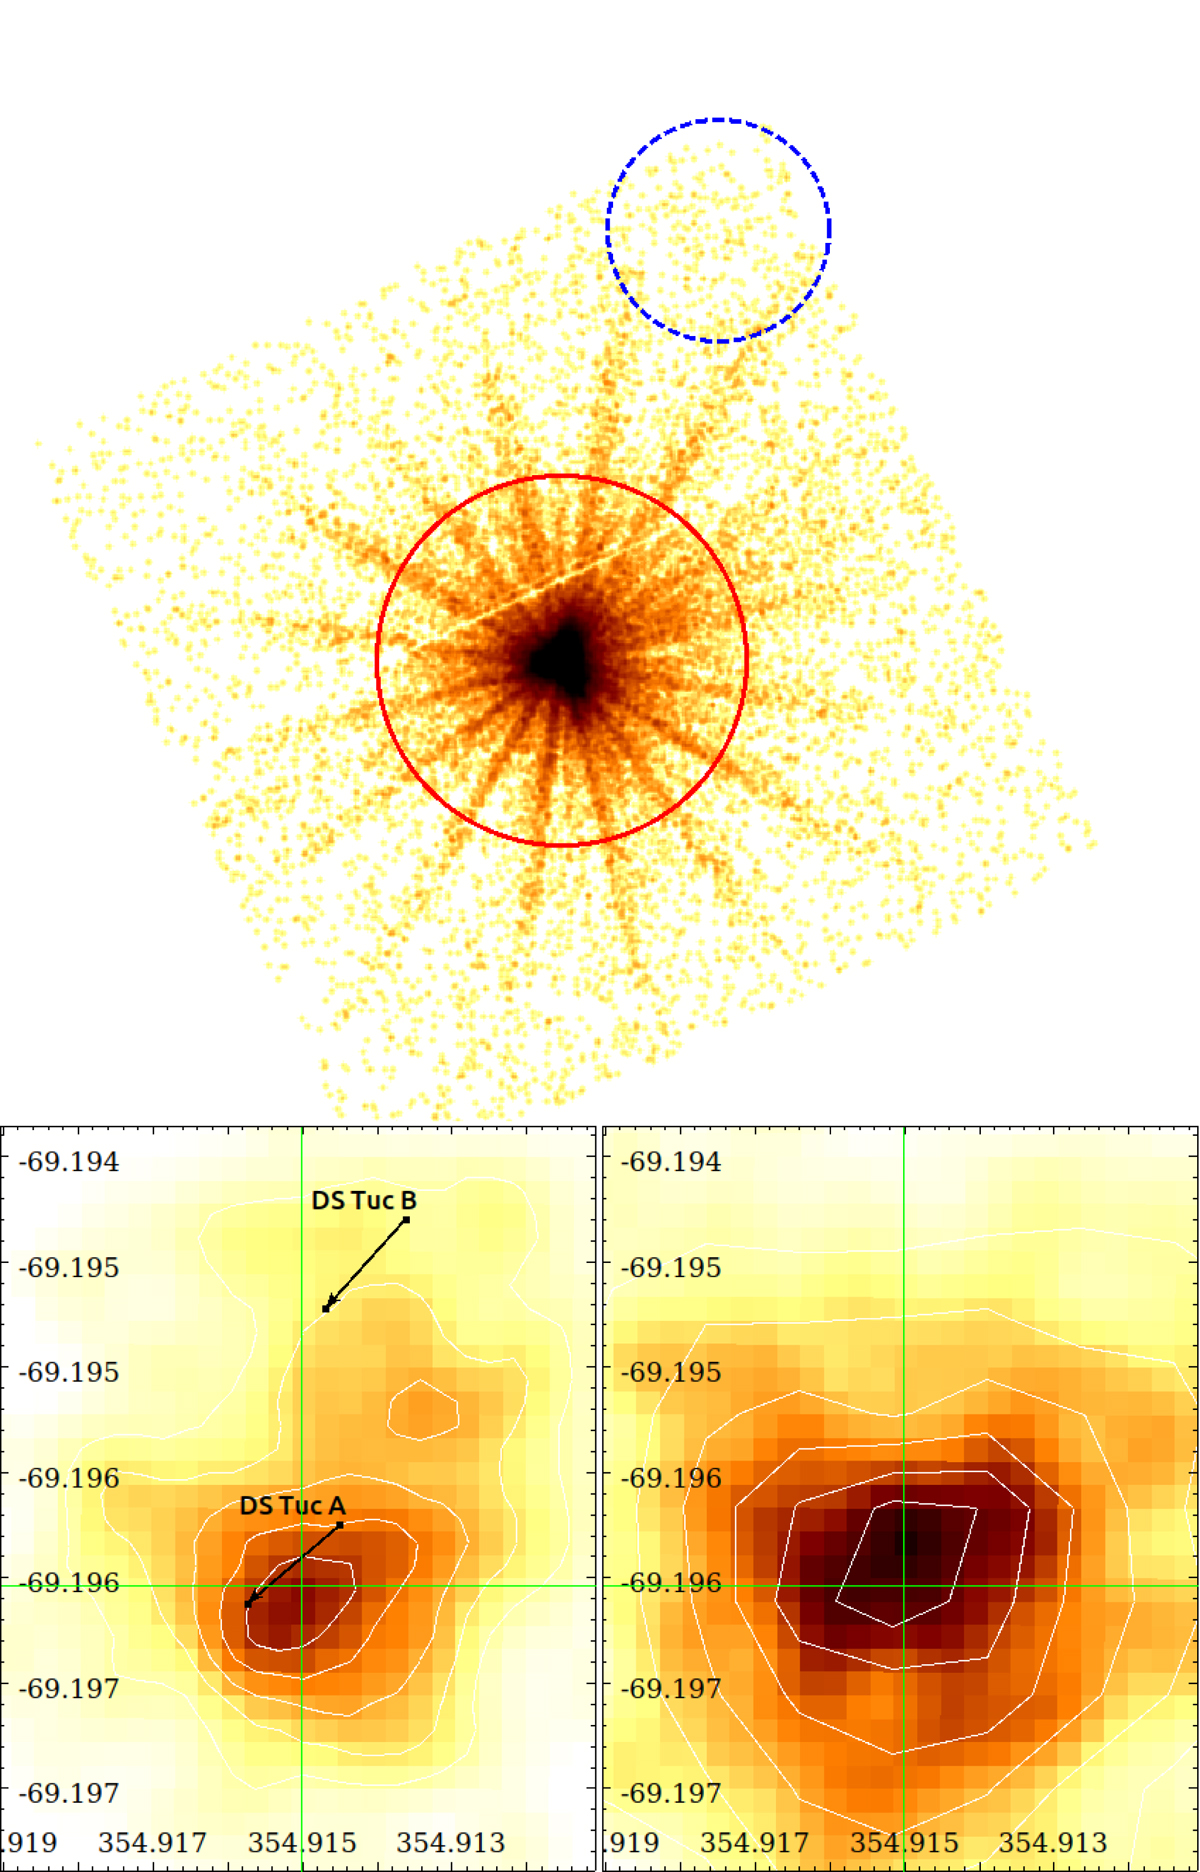
Fig. 1.
Download original image
XMM-Newton images of the DS Tuc system. Top panel: MOS 2 image of DS Tuc with the regions used for accumulating source and background events. The scale is logarithmic to enhance the background level otherwise not visible on a linear scale. The background region was offset to one of the corner of the chip to avoid the diffraction spikes from the central source. Bottom left: image of MOS 1 during the first 6 ks of observation and corresponding to interval 1 in Fig. 2. We marked the SIMBAD positions (J2000) of DS Tuc A and B and the vectors of proper motions. Bottom right: image during interval 3 corresponding to the peak of the first flare. In both images, the scale limits and color maps are identical, the binning is 8 pixels corresponding to ∼0.4″ and a smoothing with a Gaussian with σ = 1.5 pixels has been applied to images. We added contour levels with the same ranges for marking the source centroid.
Current usage metrics show cumulative count of Article Views (full-text article views including HTML views, PDF and ePub downloads, according to the available data) and Abstracts Views on Vision4Press platform.
Data correspond to usage on the plateform after 2015. The current usage metrics is available 48-96 hours after online publication and is updated daily on week days.
Initial download of the metrics may take a while.