Fig. 4.
Download original image
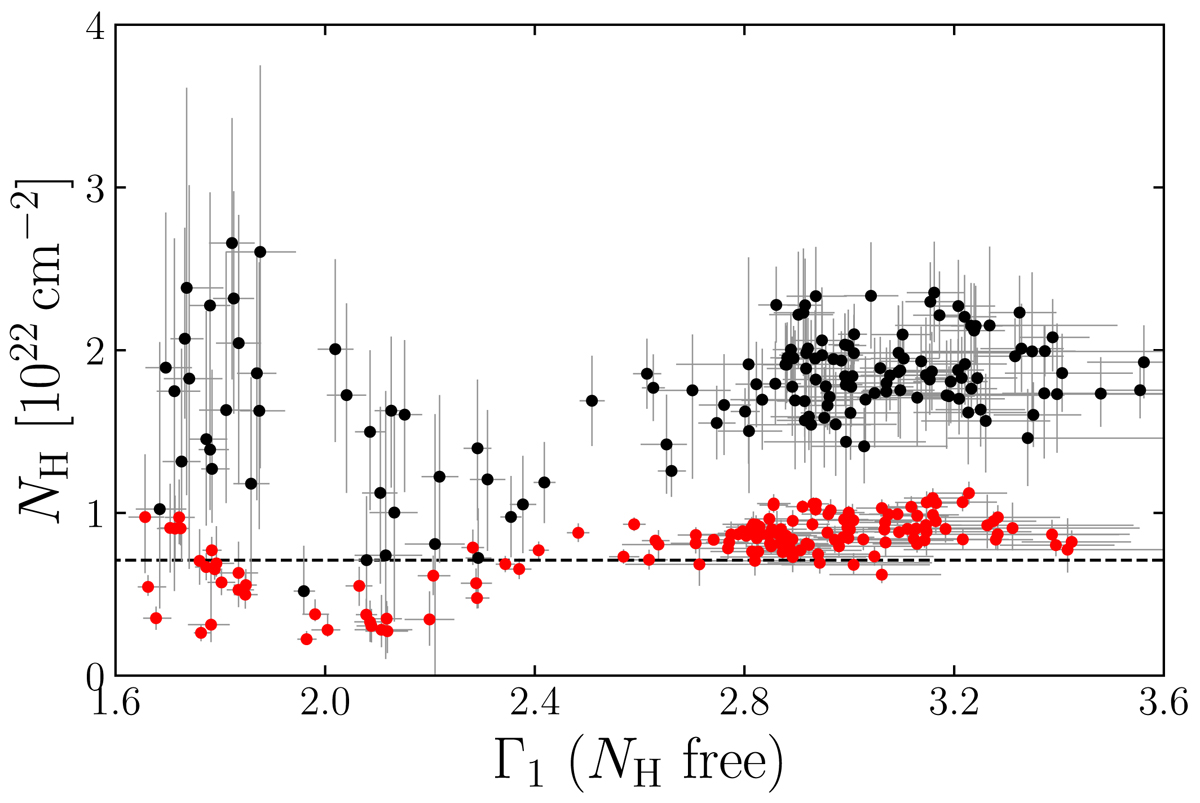
Soft photon index Γ1 of bknpower obtained by free column densities versus the obtained column densities NH during the absorption. The black dots indicate the NH obtained by the spectral fitting down to 2 keV; while the red dots indicate the NH obtained down to 1.5 keV. The dashed line represents the value 7.1 × 1021 cm−2, which is adopted during our spectral fitting.
Current usage metrics show cumulative count of Article Views (full-text article views including HTML views, PDF and ePub downloads, according to the available data) and Abstracts Views on Vision4Press platform.
Data correspond to usage on the plateform after 2015. The current usage metrics is available 48-96 hours after online publication and is updated daily on week days.
Initial download of the metrics may take a while.