Open Access
Fig. 16.
Download original image
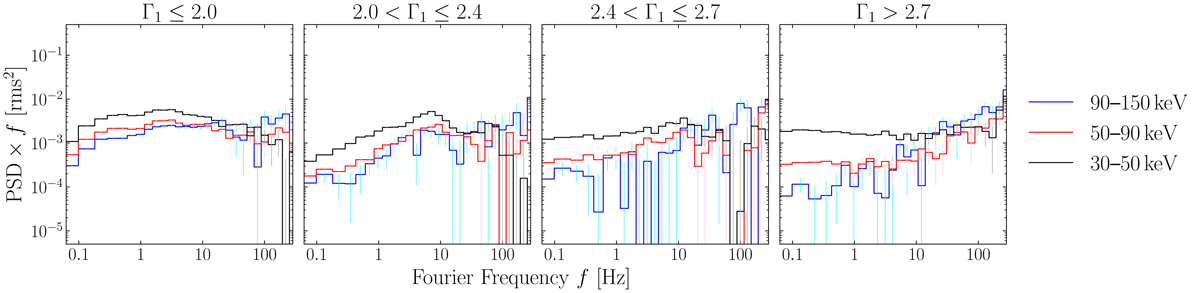
Average power spectra calculated from light curves obtained from the HE instrument in different energy bands in four different Γ1 ranges. The PSDs for the 30−50 keV band, 50−90 keV band, and 90−150 keV band are denoted with black, red, and blue lines, respectively. The PSDs are rebinned to df/f = 0.3.
Current usage metrics show cumulative count of Article Views (full-text article views including HTML views, PDF and ePub downloads, according to the available data) and Abstracts Views on Vision4Press platform.
Data correspond to usage on the plateform after 2015. The current usage metrics is available 48-96 hours after online publication and is updated daily on week days.
Initial download of the metrics may take a while.