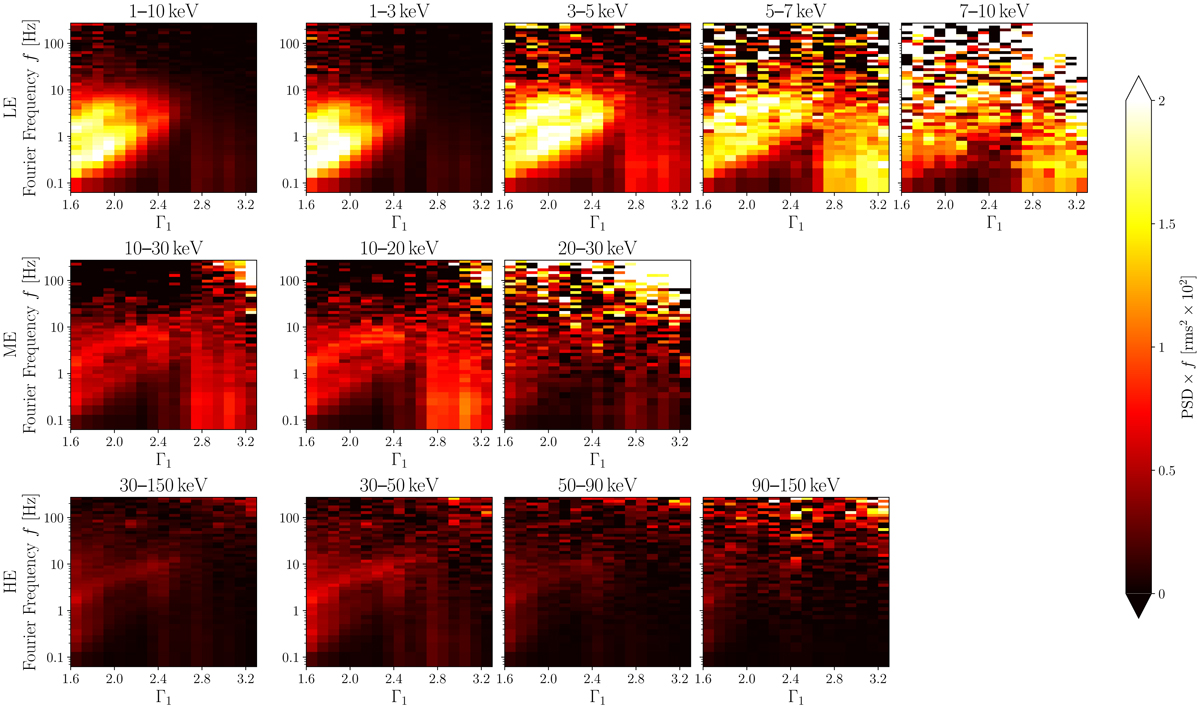
Fig. 11.
Download original image
Evolution of PSDs versus the soft photon index Γ1 from different energy bands provided by all instruments on HXMT. The color scale represents the average value of PSD(fi)×fi at individual frequencies fi. Please note that the PSD values in these plots have not been corrected by Eq. (1) in order to avoid the covering effect due to the high signal-to-background ratio.
Current usage metrics show cumulative count of Article Views (full-text article views including HTML views, PDF and ePub downloads, according to the available data) and Abstracts Views on Vision4Press platform.
Data correspond to usage on the plateform after 2015. The current usage metrics is available 48-96 hours after online publication and is updated daily on week days.
Initial download of the metrics may take a while.