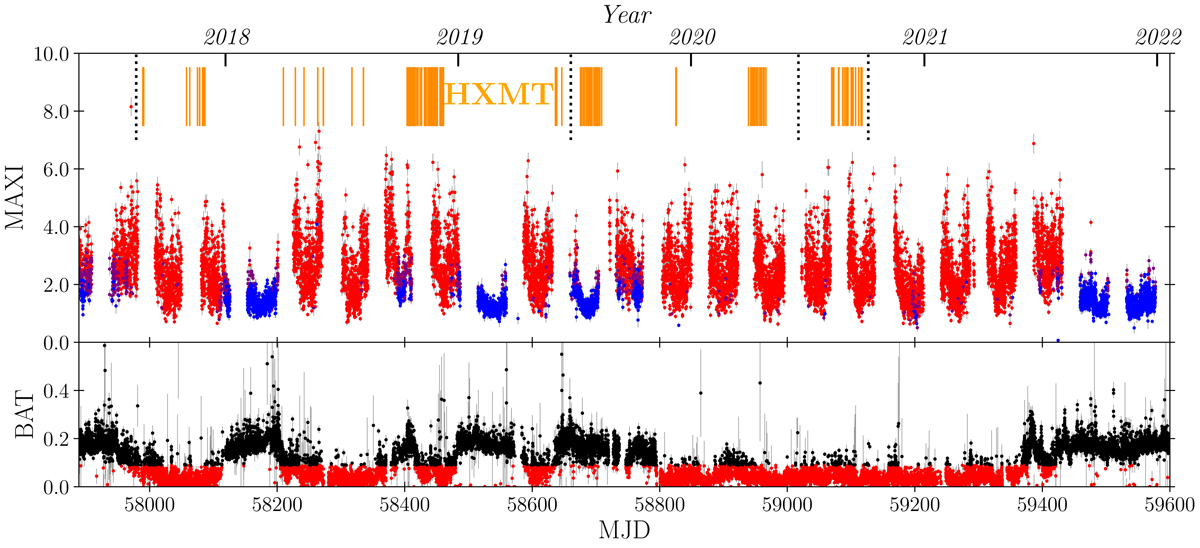
Fig. 1.
Download original image
Long-term behavior of Cygnus X-1 measured by all-sky monitors MAXI and Swift-BAT. We follow the same approaches of state definition proposed by Grinberg et al. (2013). Upper panel: the hard, intermediate, and soft states are denoted by blue, purple, and red points, respectively. Lower panel: the unclassified and soft states are plotted with black and red points, respectively. The duration of HXMT observations on Cygnus X-1 is shown in dark orange stripes at the top.
Current usage metrics show cumulative count of Article Views (full-text article views including HTML views, PDF and ePub downloads, according to the available data) and Abstracts Views on Vision4Press platform.
Data correspond to usage on the plateform after 2015. The current usage metrics is available 48-96 hours after online publication and is updated daily on week days.
Initial download of the metrics may take a while.