Fig. B.1
Download original image
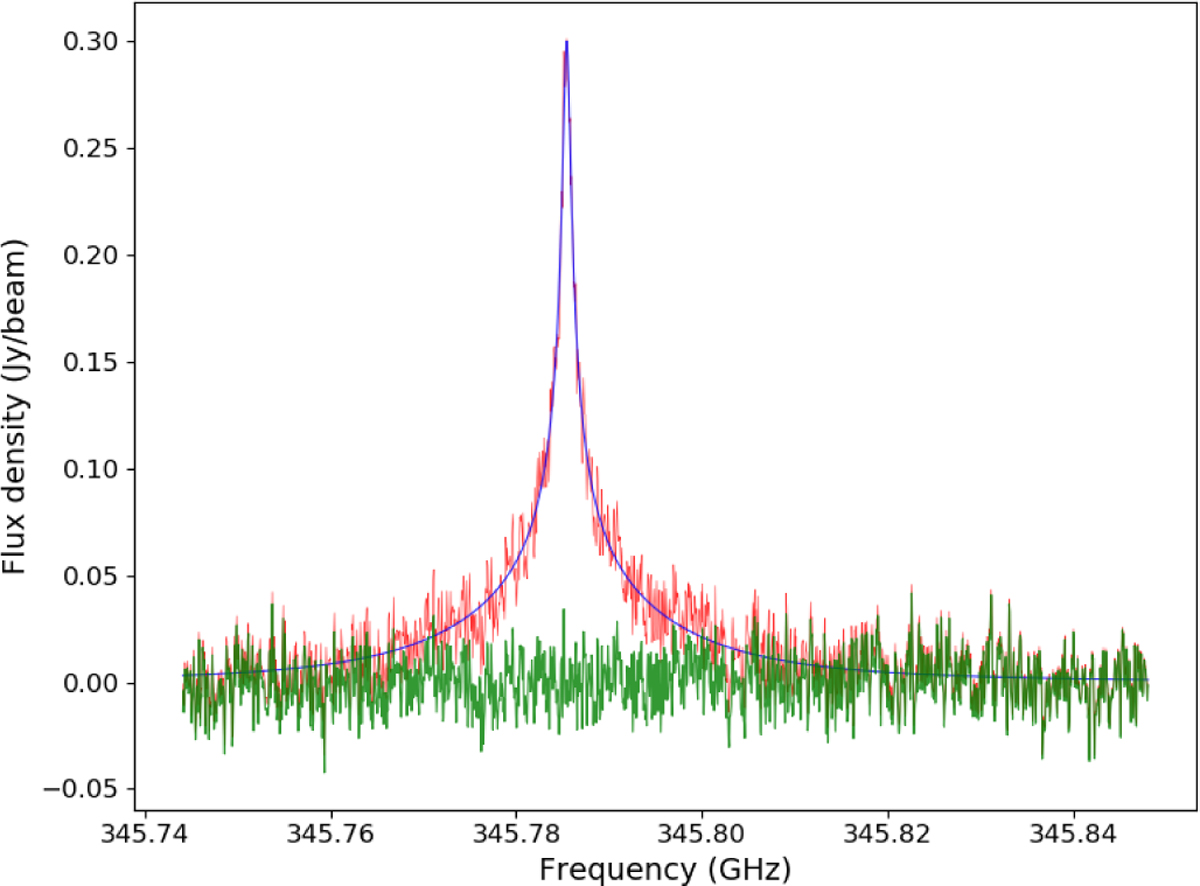
Typical CO line observed at Saturn’s limb (red line) with its associated best fit using the profile of equation B.1 (blue line) and the residuals (green line).
Current usage metrics show cumulative count of Article Views (full-text article views including HTML views, PDF and ePub downloads, according to the available data) and Abstracts Views on Vision4Press platform.
Data correspond to usage on the plateform after 2015. The current usage metrics is available 48-96 hours after online publication and is updated daily on week days.
Initial download of the metrics may take a while.