Fig. 11
Download original image
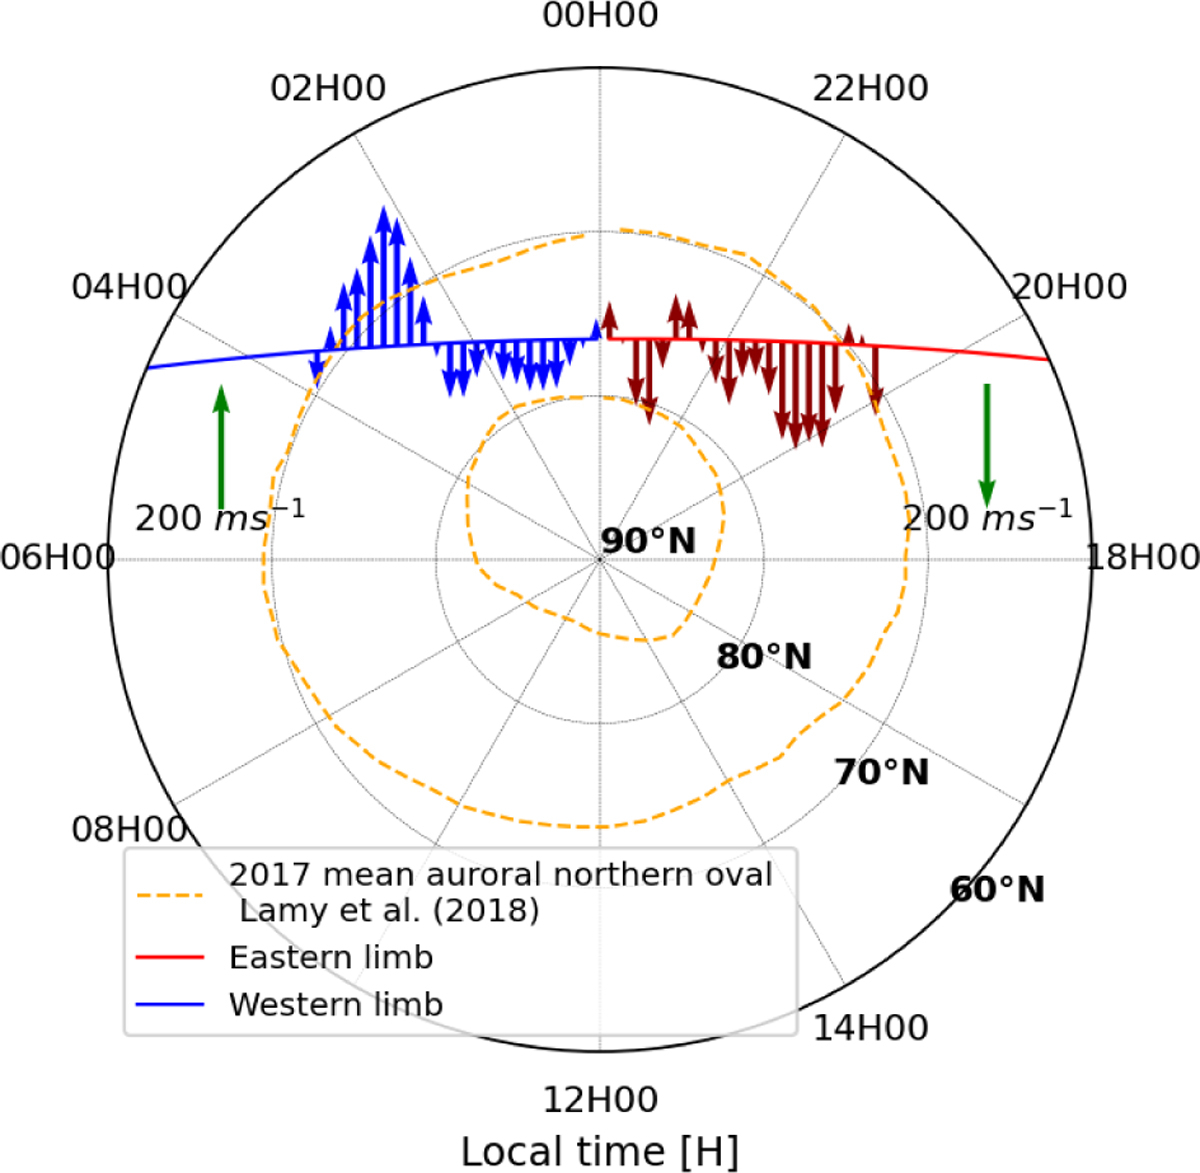
Line-of-sight jet speeds and directions north of 68°N compared to the average position of Saturn’s northern main auroral oval in 2017, as observed by Lamy et al. (2018). The red and blue arrows represent the speeds on the eastern and western limbs, respectively. The strongest winds occur around 74°N on both limbs. The green arrow key at the top right of the plot indicates a speed of 200 m s−1.
Current usage metrics show cumulative count of Article Views (full-text article views including HTML views, PDF and ePub downloads, according to the available data) and Abstracts Views on Vision4Press platform.
Data correspond to usage on the plateform after 2015. The current usage metrics is available 48-96 hours after online publication and is updated daily on week days.
Initial download of the metrics may take a while.