Open Access
Fig. 4.
Download original image
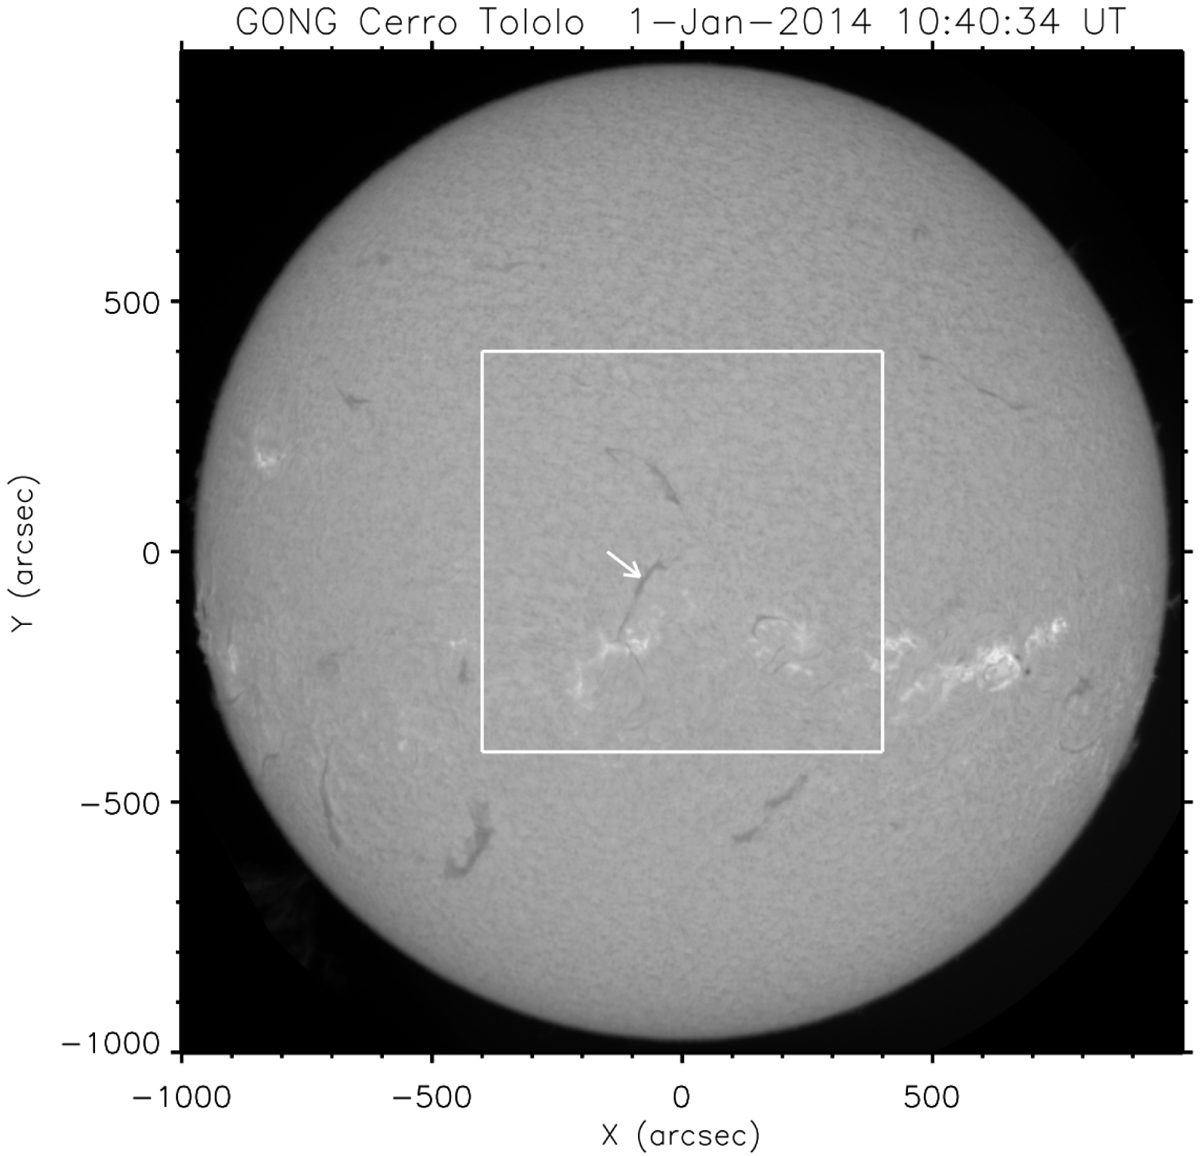
First event, analysed on January 1, 2014. Several filaments are clearly visible as dark structures on the disk. The white box delimits the ROI that was analysed in the first case considered. The arrow indicates the oscillating filament.
Current usage metrics show cumulative count of Article Views (full-text article views including HTML views, PDF and ePub downloads, according to the available data) and Abstracts Views on Vision4Press platform.
Data correspond to usage on the plateform after 2015. The current usage metrics is available 48-96 hours after online publication and is updated daily on week days.
Initial download of the metrics may take a while.