Fig. 3.
Download original image
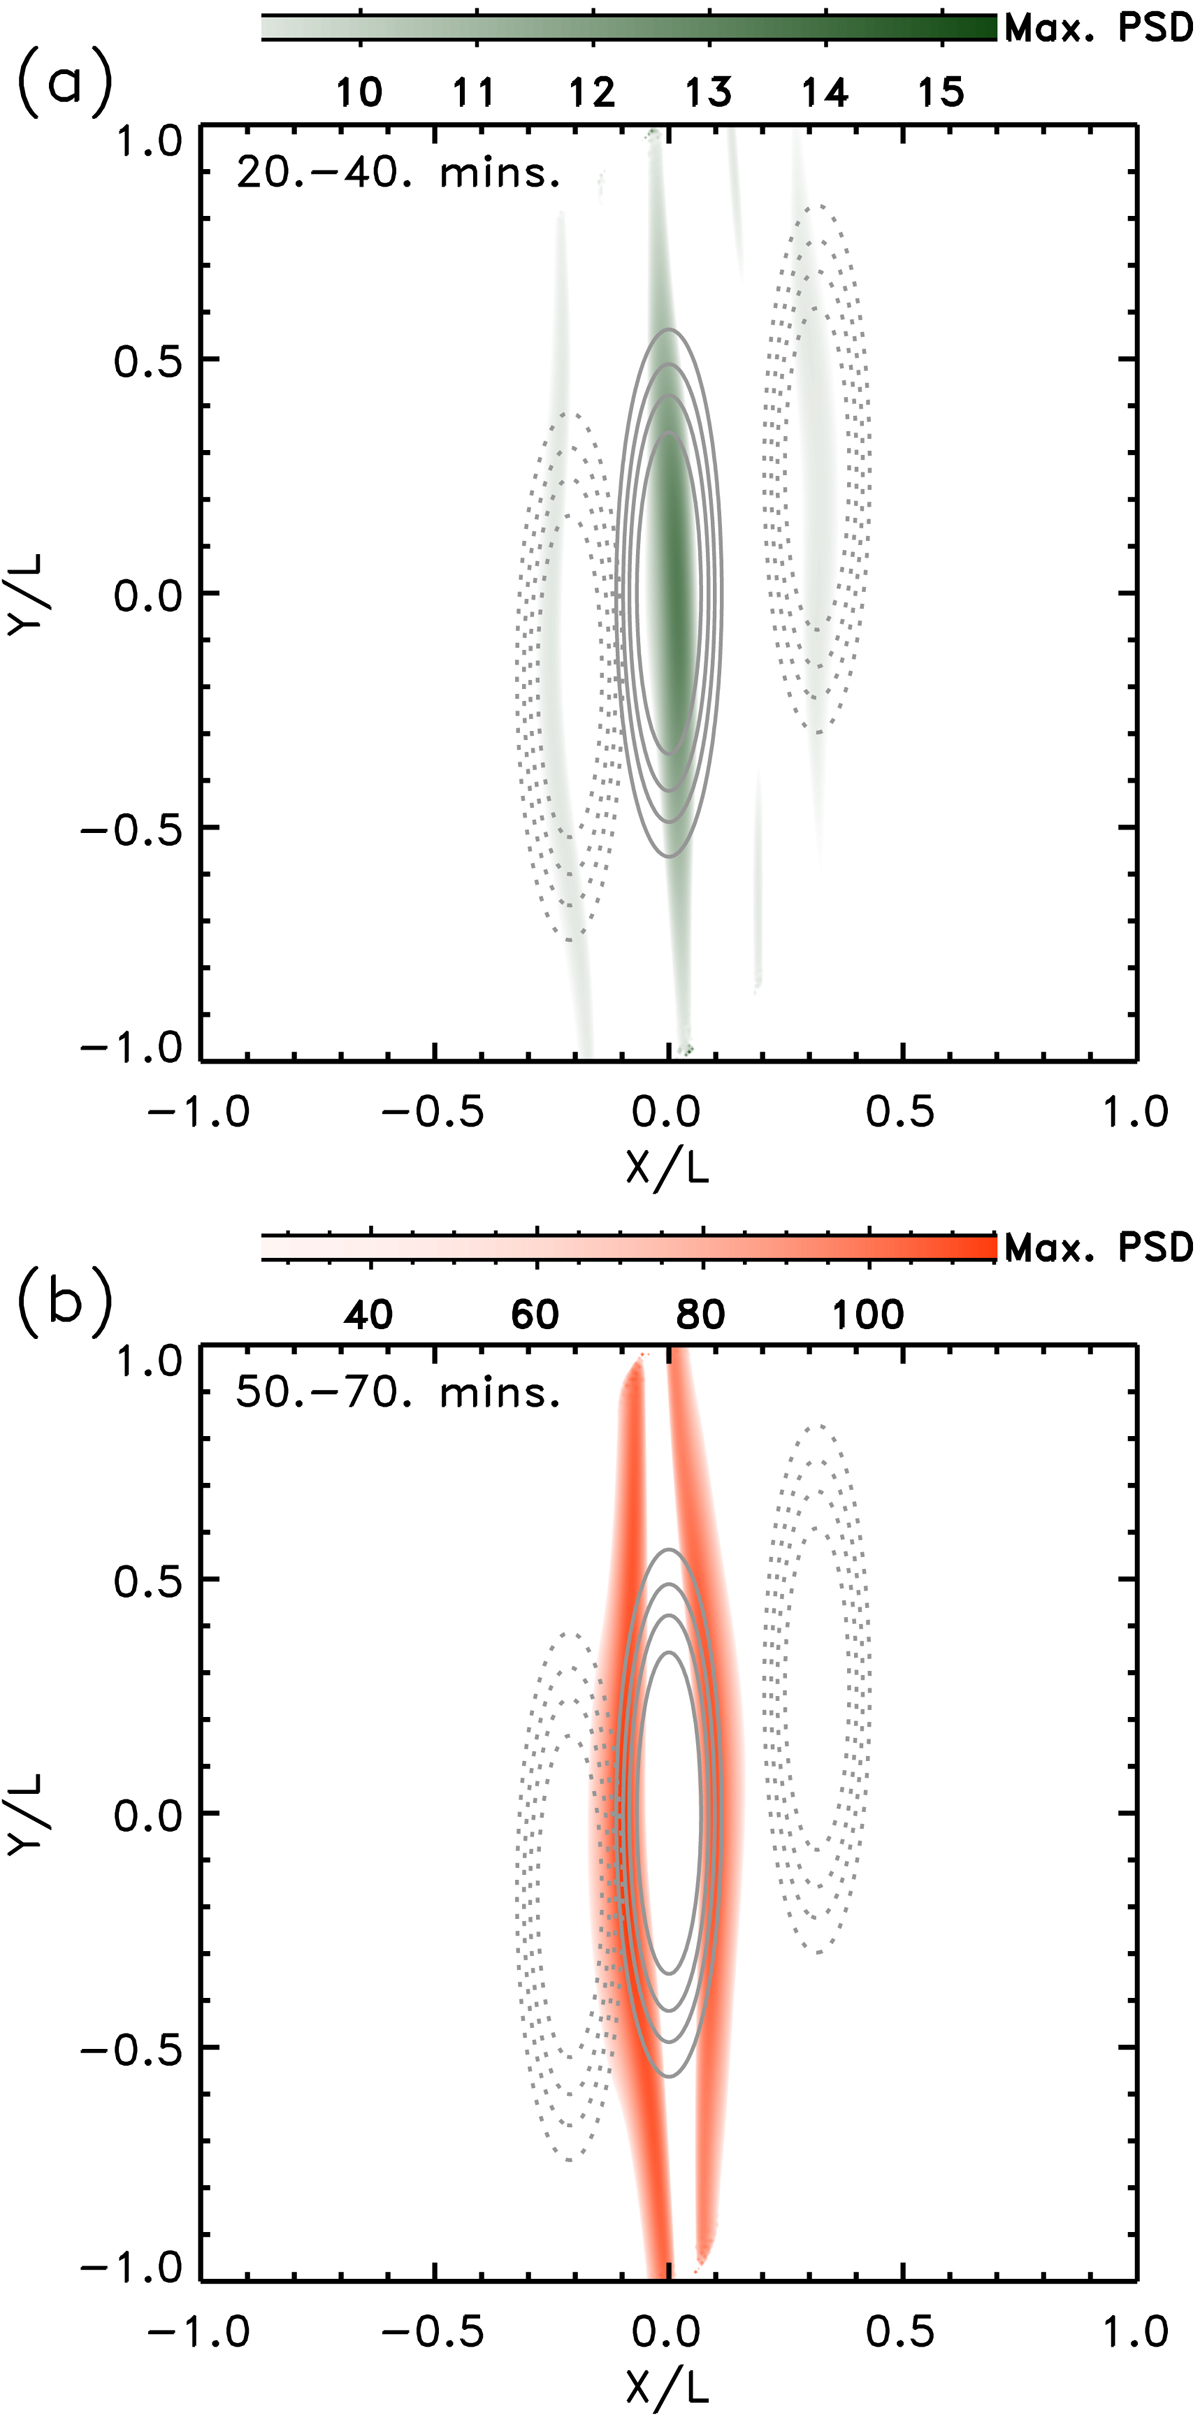
PSD projections for (a) the period range 20−40 min and (b) the period range 50−70 min. See the text for an explanation of how the projection is constructed. The solid isocontours show the filament at its equilibrium position. As in Fig. 1, dotted iscontours show the filament at maximum elongations of the filament right and left of the equilibrium.
Current usage metrics show cumulative count of Article Views (full-text article views including HTML views, PDF and ePub downloads, according to the available data) and Abstracts Views on Vision4Press platform.
Data correspond to usage on the plateform after 2015. The current usage metrics is available 48-96 hours after online publication and is updated daily on week days.
Initial download of the metrics may take a while.