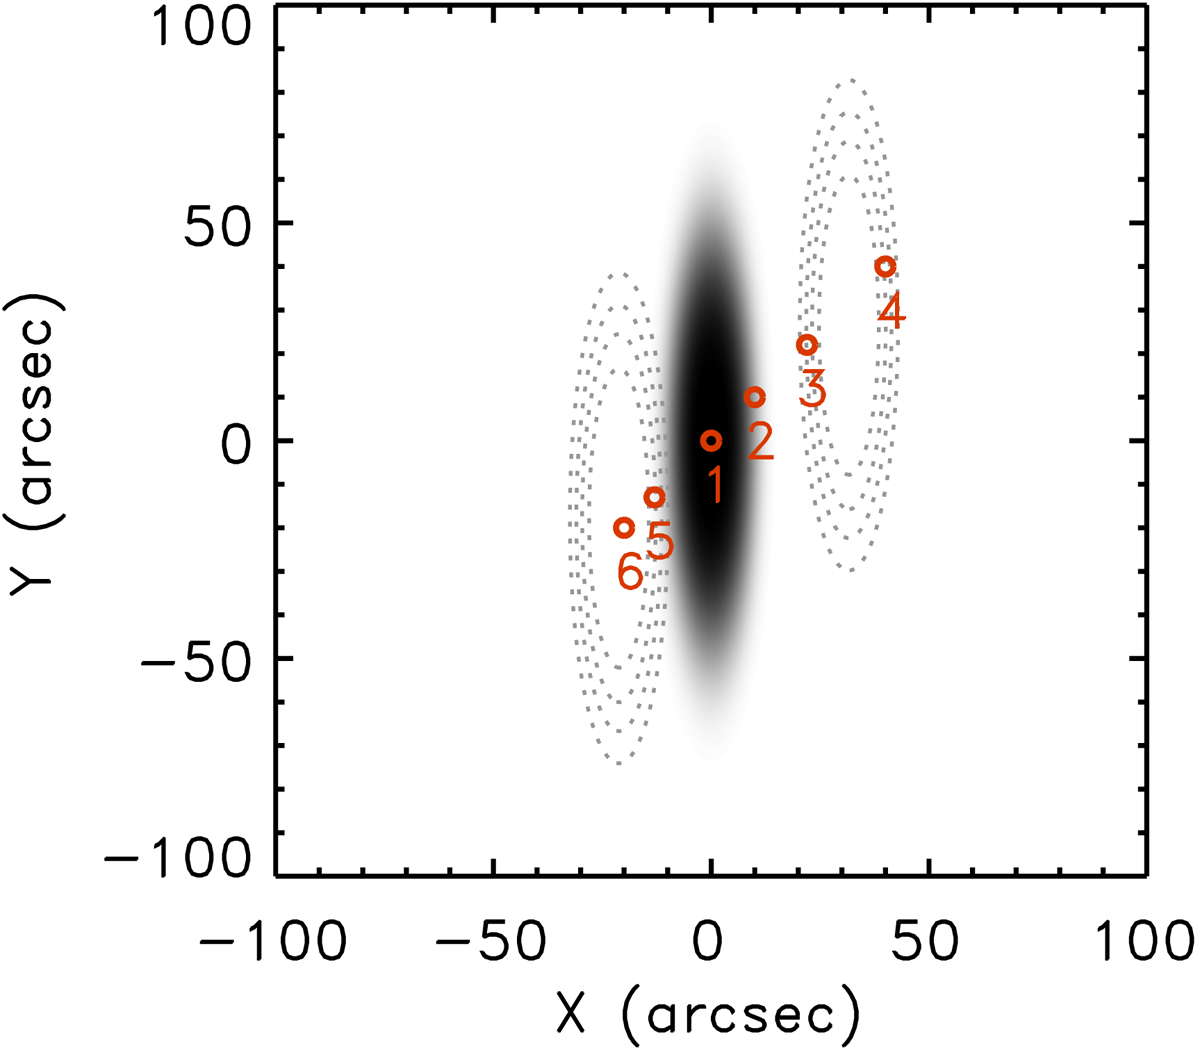
Fig. 1.
Download original image
Intensity given by I(x, y) (see text) mimicking a GONG Hα map. The dark area corresponds to the filament seen in absorption. The filament oscillates with a period, P = 60 min, damping time, τ = 75 min, and a direction of 45° with respect to the x-axis. The dotted isocontours at x > 0 show the position of the filament at t = P/4 when the filament reaches its maximum elongation right of the equilibrium position. Similarly, the dotted isocontours at x < 0 show the filament at t = 3/4P when the filament reaches the maximum elongation at the left. The six red circles show the positions along the oscillation trajectory where the intensity fluctuations are studied in detail in Fig. 2.
Current usage metrics show cumulative count of Article Views (full-text article views including HTML views, PDF and ePub downloads, according to the available data) and Abstracts Views on Vision4Press platform.
Data correspond to usage on the plateform after 2015. The current usage metrics is available 48-96 hours after online publication and is updated daily on week days.
Initial download of the metrics may take a while.