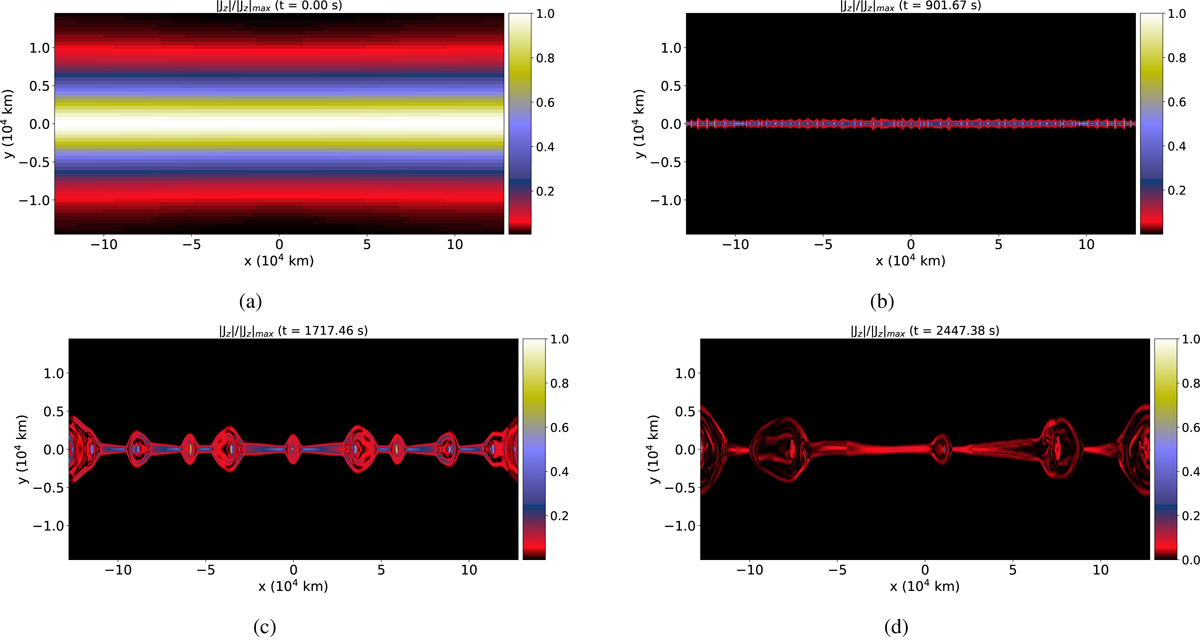
Fig. 2.
Download original image
Distribution of the absolute current density, |Jz|, normalized with the instantaneous absolute peak current density, |Jmax|, for different evolution stages. The y-domain is only shown in the range −1.45 × 10⁴ km ≤ y ≤ +1.45 × 10⁴ km, which contains the region of the current sheet. An animation of the figures is available online.
Current usage metrics show cumulative count of Article Views (full-text article views including HTML views, PDF and ePub downloads, according to the available data) and Abstracts Views on Vision4Press platform.
Data correspond to usage on the plateform after 2015. The current usage metrics is available 48-96 hours after online publication and is updated daily on week days.
Initial download of the metrics may take a while.