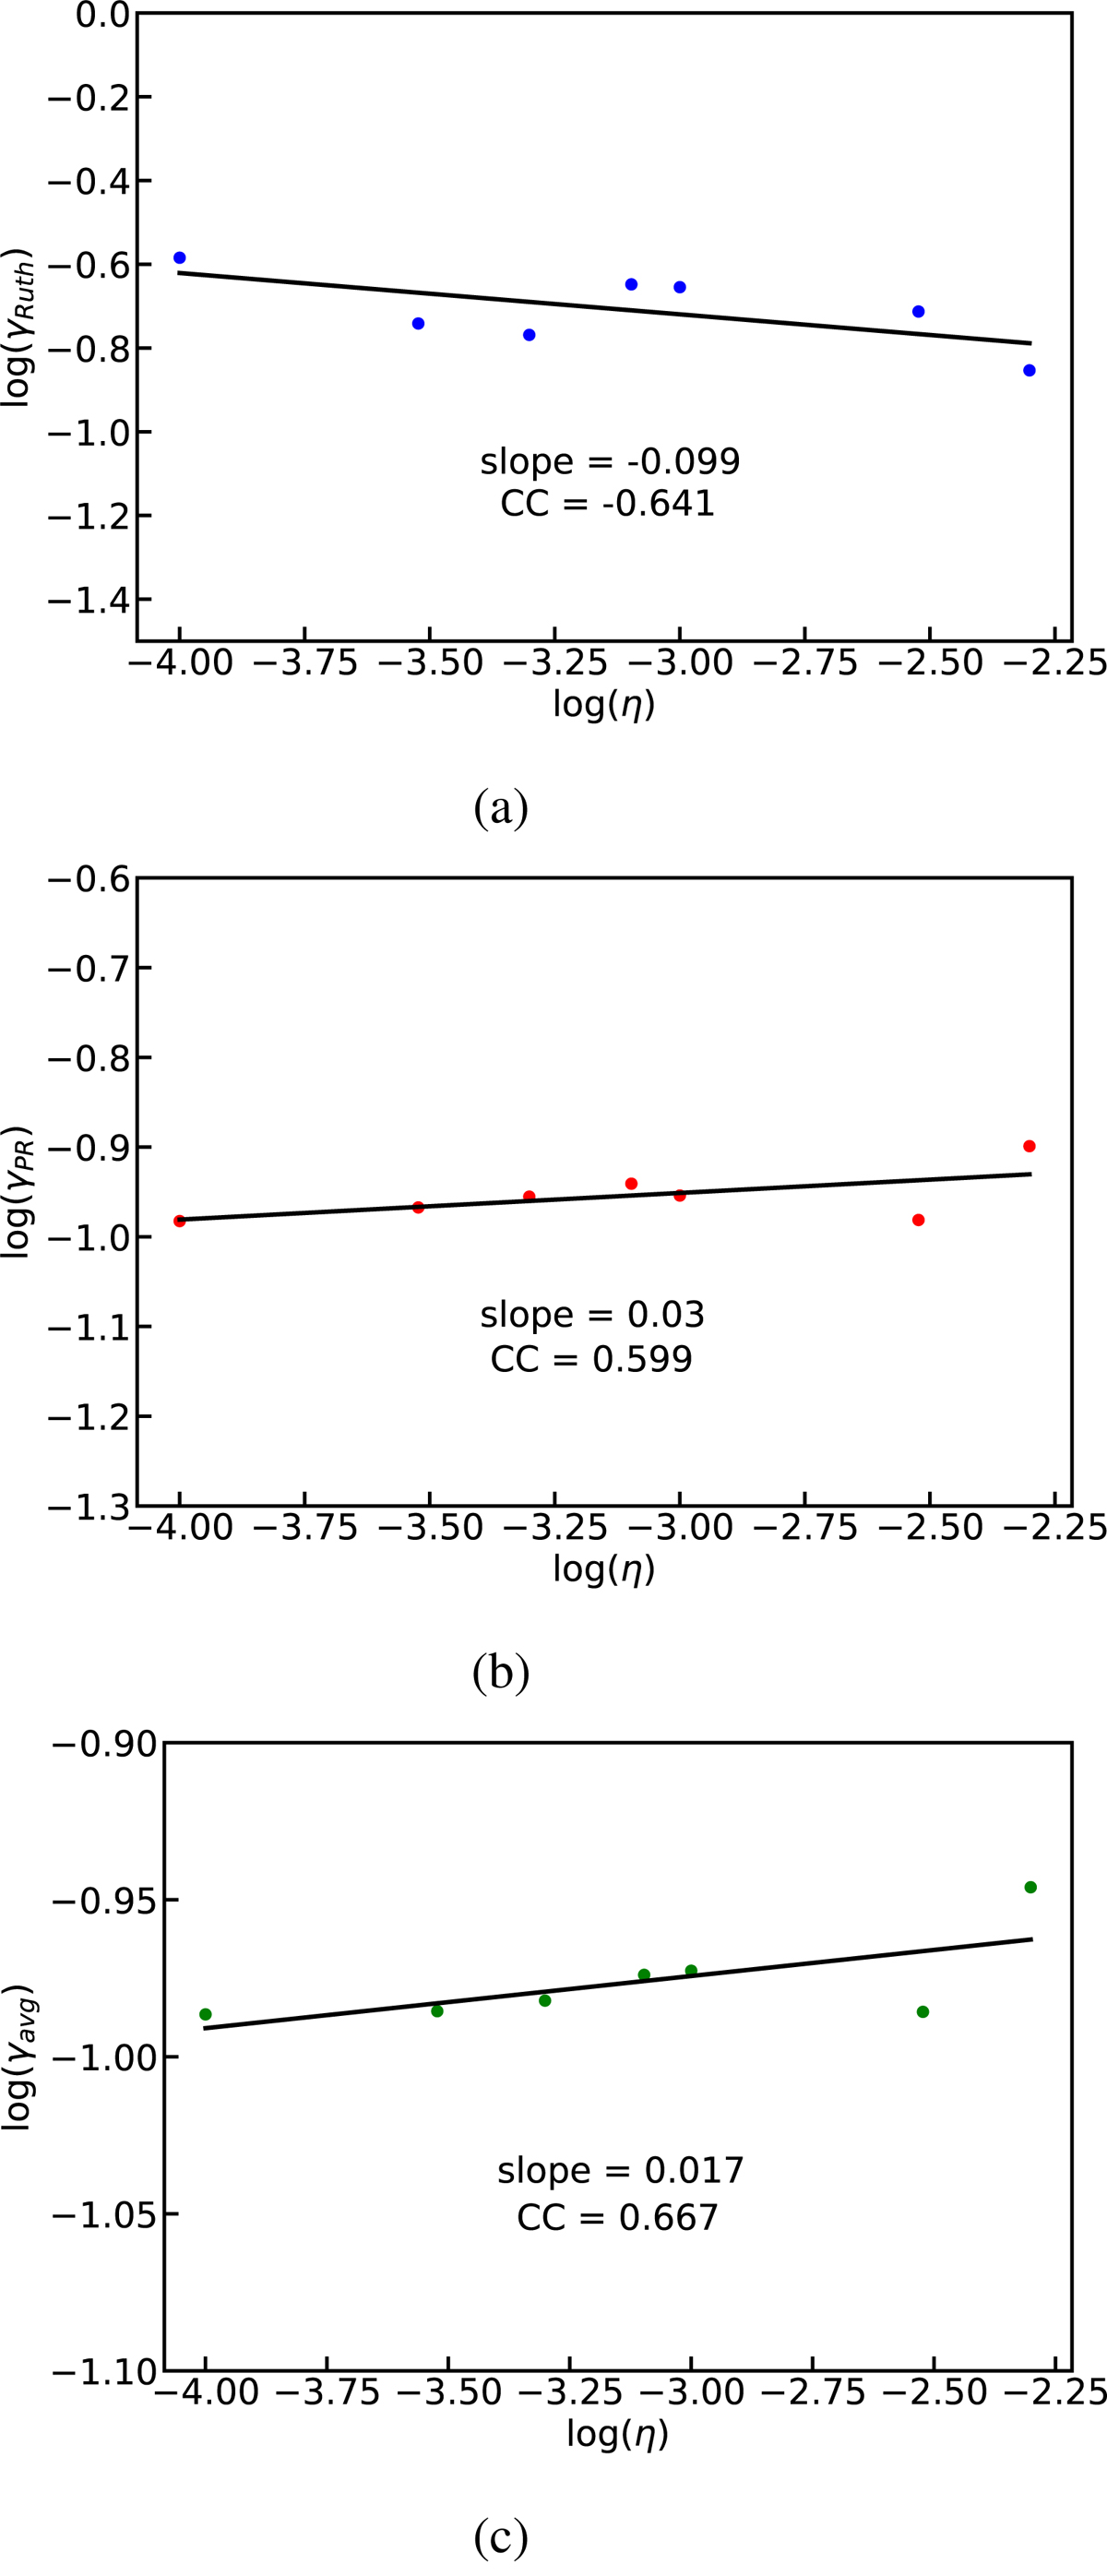
Fig. 15.
Download original image
Variation in the average growth rates, γ with the resistivities for (a) Rutherford, (b) Post-Rutherford, and (c) entire nonlinear regions. The growth rates are scaled with respect to the Alfvén timescale. The solid lines represent the linear fit of the growth rates vs. η in the log-log scale. The values of the slope and the correlation coefficients are noted in the corresponding figures.
Current usage metrics show cumulative count of Article Views (full-text article views including HTML views, PDF and ePub downloads, according to the available data) and Abstracts Views on Vision4Press platform.
Data correspond to usage on the plateform after 2015. The current usage metrics is available 48-96 hours after online publication and is updated daily on week days.
Initial download of the metrics may take a while.