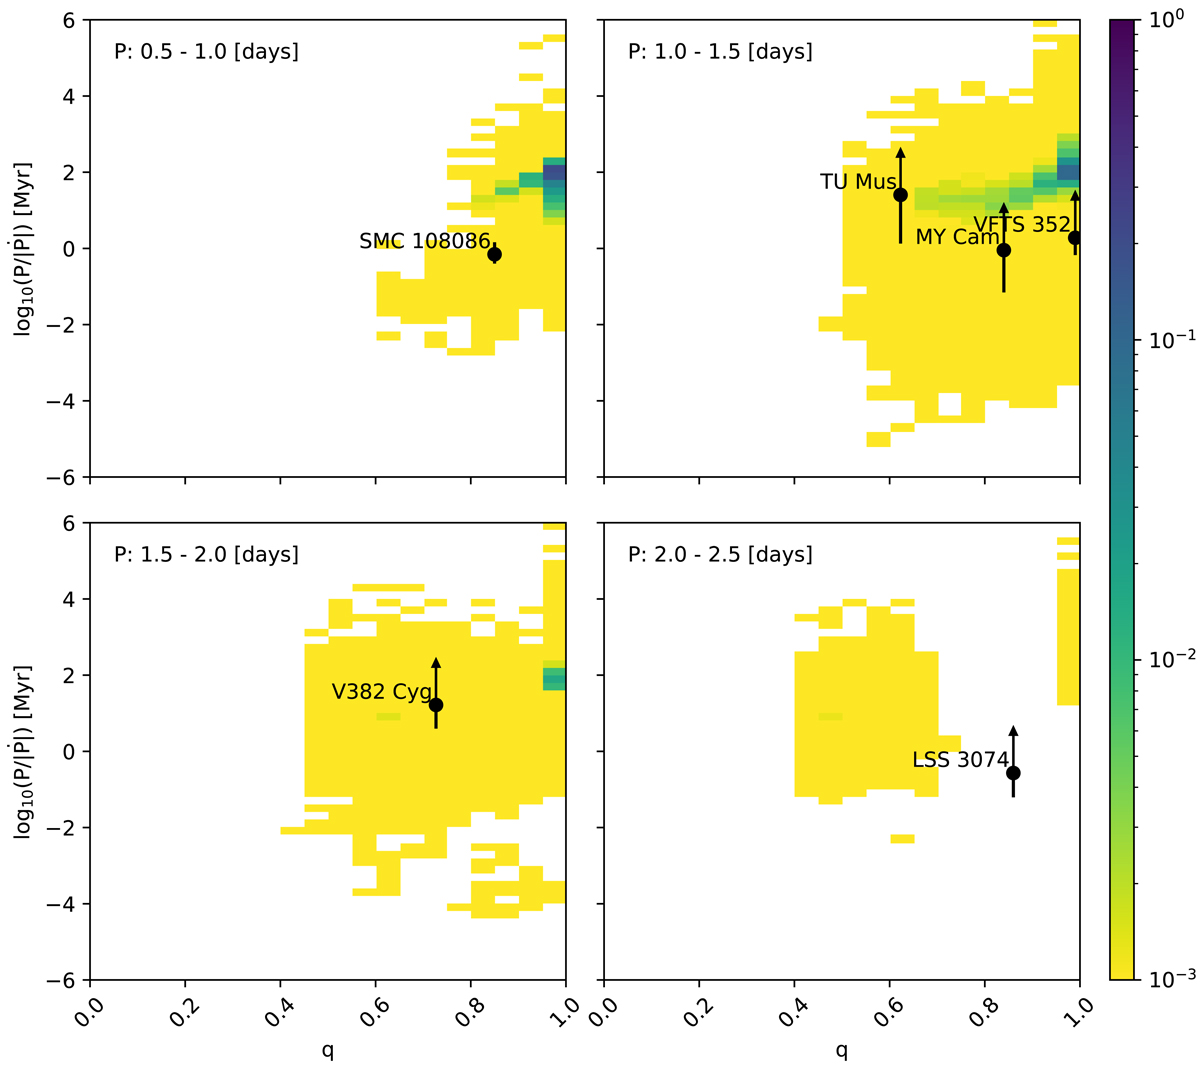
Fig. 5.
Download original image
Normalized theoretical probability distribution of the P/|Ṗ| as a function of the mass ratio based on models from Menon et al. (2021). The background color represents the probability of finding a system with the given combination of parameters. Lighter colors represent lower probabilities while darker colors represent higher probabilities. Each of the four panels represents a different period bin, which is indicated in the upper-left corner. The locations of the observed overcontact systems are indicated with black dots and labeled. Error bars are also plotted for each system and when applicable, arrows are used to indicate that the value does not have an upper limit.
Current usage metrics show cumulative count of Article Views (full-text article views including HTML views, PDF and ePub downloads, according to the available data) and Abstracts Views on Vision4Press platform.
Data correspond to usage on the plateform after 2015. The current usage metrics is available 48-96 hours after online publication and is updated daily on week days.
Initial download of the metrics may take a while.