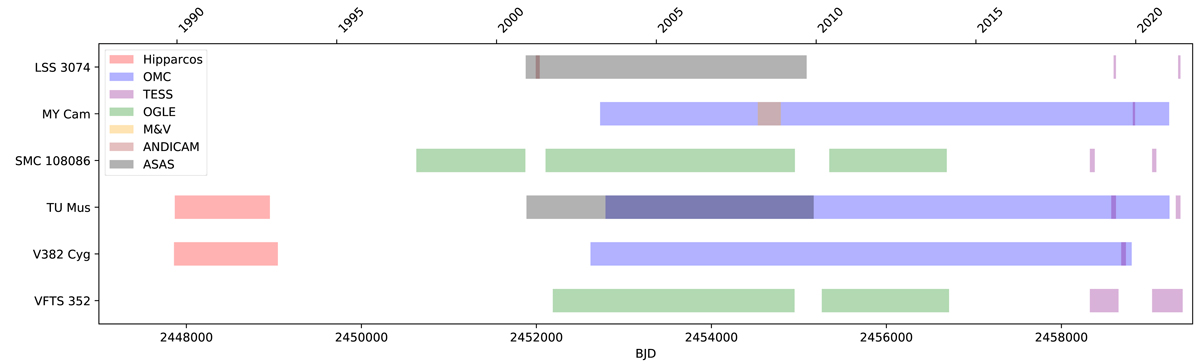
Fig. 1.
Download original image
Overview of the photometric data available for each object in our sample. Each color-shaded region corresponds to a different instrument or data set. Red indicates HIPPARCOS, blue indicates INTEGRAL-OMC, green indicates OGLE, black indicates ASAS, brown indicates ANDICAM, yellow indicates data from Lorenzo et al. (2014), and data from TESS are indicated in purple. We note that these ranges indicate the date ranges of the respective data sets, some of which are sporadic and without a regular cadence.
Current usage metrics show cumulative count of Article Views (full-text article views including HTML views, PDF and ePub downloads, according to the available data) and Abstracts Views on Vision4Press platform.
Data correspond to usage on the plateform after 2015. The current usage metrics is available 48-96 hours after online publication and is updated daily on week days.
Initial download of the metrics may take a while.